
Developer Tooling
Grafana dashboard provisioning: UIDs, updates, and drift
Grafana file provisioning can keep a dashboard definition under version control, but you still need to decide whether UI changes are allowed. With allowUiUpdates: false, Grafana rejects attempts to save a provisioned dashboard through the tested dashboard API. Editing its source file then updates the dashboard under the same UID.
This Grafana 12.1.1 lab verifies that behavior with a provisioned Prometheus data source. It checks the dashboard’s identity, tests data source health, attempts an authenticated overwrite, and changes the source file. A one-panel chart keeps the query easy to inspect. These checks catch configuration drift that a successful Grafana startup alone would miss, while preserving a clear path for reviewed dashboard changes.
The Grafana example and test runner are available with the recorded results.
Run the Grafana provisioning test
Before you start:
- Install Python 3.11 or newer, Git, and Docker. Confirm the Docker engine is running with
docker info. - Run the commands from the repository root after cloning. The examples use pinned container versions and download them on the first run.
- Use a local development machine with room for disposable containers. The harness removes the resources it creates.
It starts a small Prometheus server and Grafana on a temporary Docker network. Grafana’s host port binds only to loopback, while Prometheus is addressed by a network alias inside that network.
git clone https://github.com/emminextechdocs/developer-examples.git
cd developer-examples
python3 deep-dives/walkthrough.py grafana
The harness checks the actual HTTP APIs, records results in deep-dives/evidence/grafana.json, and removes its containers and network. It copies the dashboard into a temporary directory before modifying it, so the source-controlled fixture remains unchanged.

This is the running test client. The browser walkthrough later in the article keeps Grafana open so you can inspect the provisioned dashboard yourself.
Inspect the result before changing the example
The runner writes a fresh JSON record and exits after cleanup. To print only its assertions, run:
python3 - <<'PYTHON'
import json
from pathlib import Path
report = json.loads(Path("deep-dives/evidence/grafana.json").read_text())
assert report["passed"] is True
for event in report["events"]:
    if "assertion" in event:
        print(event["assertion"], "=>", event["actual"])
PYTHON
This prints each assertion and its observed value from your latest run. If a check fails, fix its setup or implementation and rerun the lab. The following sections explain what the checks establish.
Open the provisioned dashboard and follow its data
To keep a browser session available after the automated test, start the Docker Compose v2 companion:
docker compose -p emminex-observe -f deep-dives/observability/compose.yml up -d- Open
http://127.0.0.1:13000/d/reliability-lab. The anonymous session has the Viewer role. - Wait for the first Prometheus scrapes. The self-scrape panel should show
1while the target is up. - Compare the synthetic checkout panels: about 100 observations per second, a slow fraction near 2%, and budget burn near 20.
- Inspect
deep-dives/observability/dashboards/reliability.json. Its panel queries use data source UIDprom-lab; the dashboard UID remainsreliability-lab.
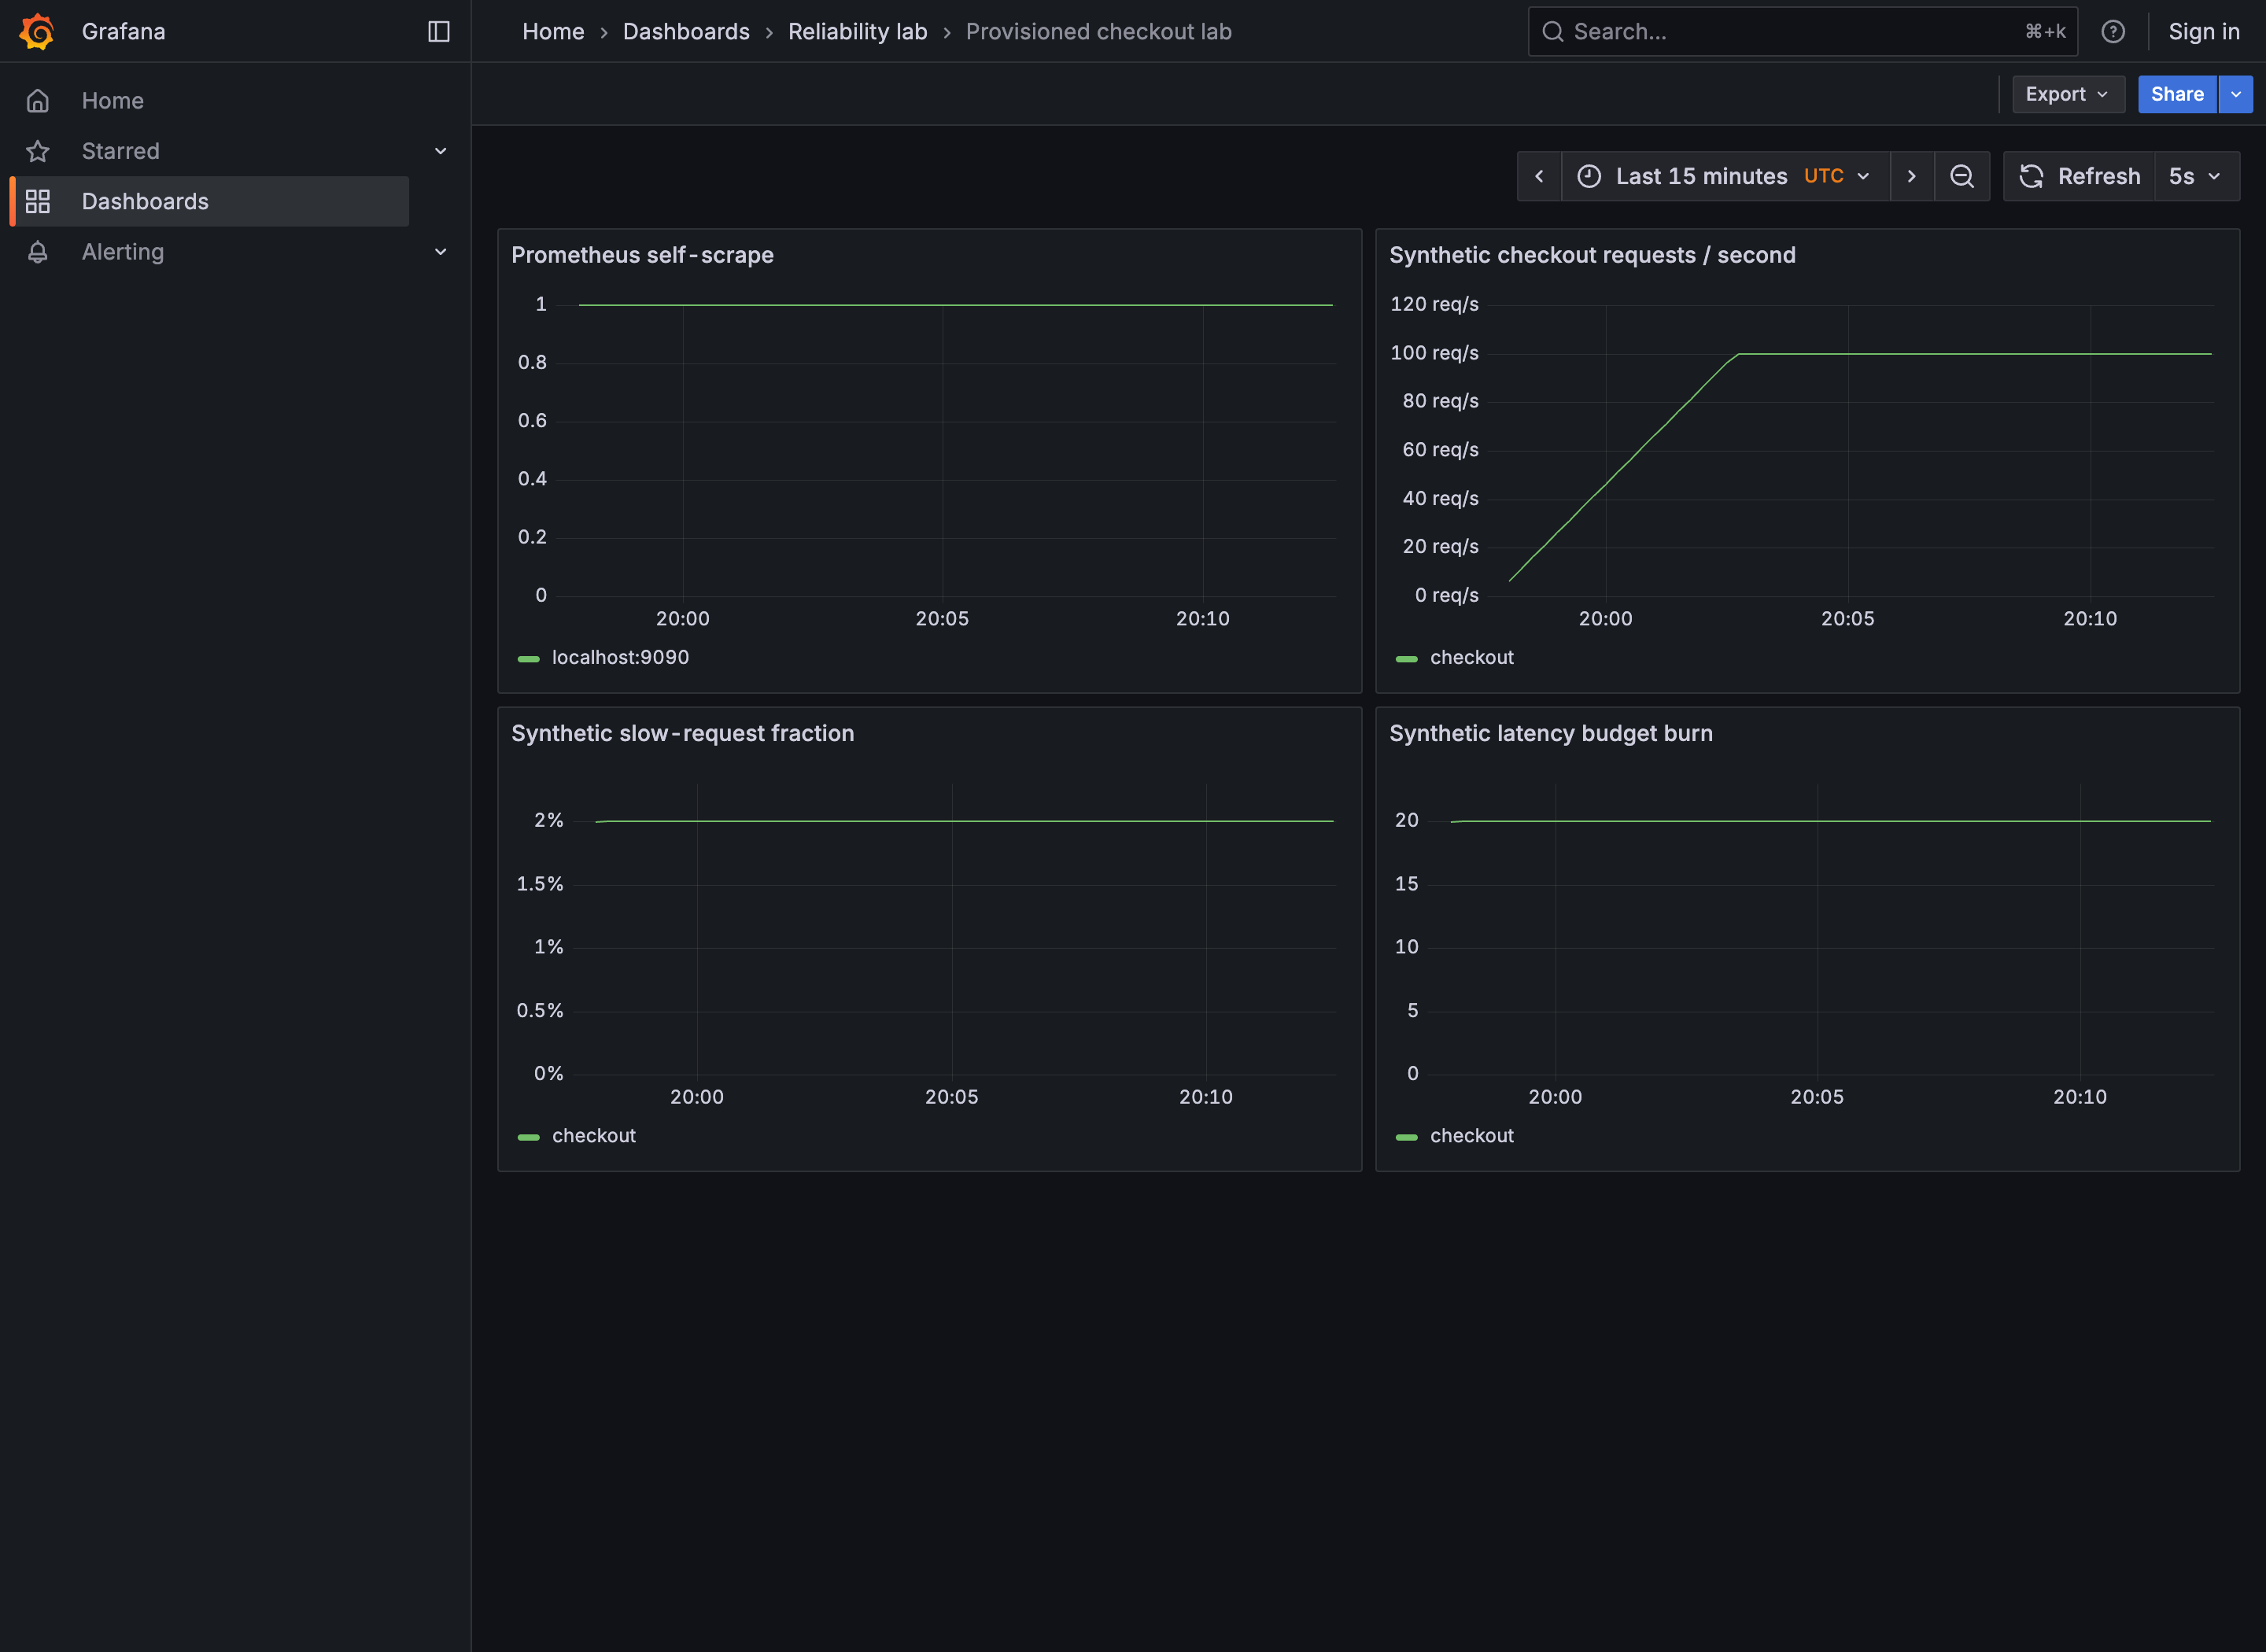
The companion adds three panels to the automated lab’s single self-scrape panel. Their data comes from generated counters, not a real checkout application. Open the full-resolution dashboard.
If a panel is empty, open http://127.0.0.1:19090 and execute its expression directly. This separates missing Prometheus data from a Grafana query or data source problem. To test file provisioning yourself, change only the companion dashboard’s title in its JSON file, wait for the provider’s 15-second polling cycle, then refresh the dashboard. The title should change while the UID and /d/reliability-lab route still identify the same dashboard. Keep the file as valid JSON.
Stop this companion when finished:
docker compose -p emminex-observe -f deep-dives/observability/compose.yml down -vChoose the dashboard source of truth
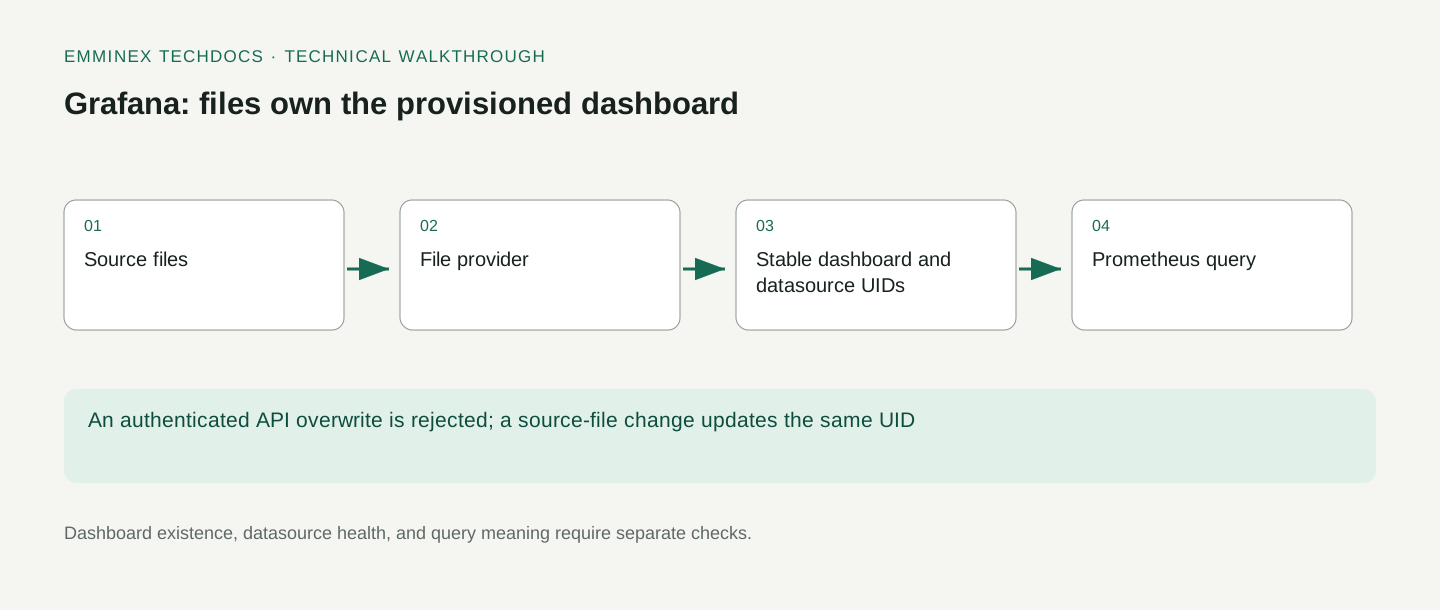
The example chooses files as the authority. Grafana imports the dashboard, but operators should change the source-controlled definition rather than save a competing database version through the UI. That policy is implemented with the provider’s allowUiUpdates setting.
Grafana’s provisioning documentation explains that UI changes do not automatically update the provisioning source. If UI updates are allowed, later source-file changes can overwrite them. Treating both locations as equally authoritative therefore creates conflicting dashboard versions.
Choose a workflow your team can maintain. File ownership works well when dashboard changes are reviewed with the application. An exploratory dashboard can follow another workflow, but make its ownership explicit rather than assuming every dashboard must use the same process.
Assign a stable data source UID
The data source definition uses UID prom-lab. The dashboard panel refers to that UID instead of depending on an installation-specific numeric ID. This keeps the relationship explicit when the fixture is started in a new Grafana database.
apiVersion: 1
datasources:
  - name: Lab Prometheus
    type: prometheus
    uid: prom-lab
    access: proxy
    url: http://metrics:9090
    isDefault: true
    editable: false
    jsonData:
      httpMethod: POST
The URL is http://metrics:9090, where metrics is the Docker network alias assigned to Prometheus. It is reachable from Grafana’s server process. It is not a URL that the reader’s browser needs to resolve.
When debugging a panel, check where the request originates. A browser successfully opening a Prometheus page does not prove Grafana can reach the configured data source, and the reverse is also true. The Prometheus data source configuration guide describes the server connection settings. Test the connection from the component that actually makes it.
Configure the dashboard file provider
The provider points to a mounted directory containing dashboard JSON. It places the dashboard in Reliability lab, disables UI updates, and sets deletion behavior explicitly. Review these settings alongside the dashboard JSON.
apiVersion: 1
providers:
  - name: lab-files
    folder: Reliability lab
    type: file
    disableDeletion: true
    allowUiUpdates: false
    updateIntervalSeconds: 15
    options:
      path: /var/lib/grafana/dashboards
These provider settings have separate jobs:
pathidentifies the mounted directory Grafana scans.updateIntervalSeconds: 15sets the polling interval used by this example.allowUiUpdates: falserejects dashboard saves through Grafana.disableDeletion: trueprevents source-file removal from automatically deleting the provisioned dashboard.
A read-only container mount protects the file from writes inside the container. It does not stop a developer from changing the host file that Grafana polls.
disableDeletion and allowUiUpdates answer different questions. One controls provisioning-related deletion behavior; the other controls whether changes to provisioned dashboards can be saved through the UI. Neither setting is a replacement for Grafana authentication or filesystem permissions.
Also choose an update interval with the mount behavior in mind. Grafana documents different file-change detection behavior around the ten-second threshold and notes that filesystem events may not propagate through every mount. The provider polls every 15 seconds. The test waits until the API returns the changed title.
Inspect the dashboard JSON
The dashboard has one time-series panel querying up{job="prometheus"}. It fixes the dashboard UID, panel ID, data source UID, time range, and refresh interval. A minimal example makes it easier to identify which field creates the relationship under test.
{
  "uid": "reliability-lab",
  "title": "Provisioned reliability dashboard",
  "schemaVersion": 41,
  "version": 1,
  "timezone": "utc",
  "time": {"from": "now-15m", "to": "now"},
  "refresh": "5s",
  "panels": [
    {"id": 1, "title": "Prometheus self-scrape", "type": "timeseries",
     "datasource": {"type": "prometheus", "uid": "prom-lab"},
     "gridPos": {"x": 0, "y": 0, "w": 24, "h": 10},
     "targets": [{"refId": "A", "expr": "up{job=\"prometheus\"}", "legendFormat": "{{instance}}"}],
     "fieldConfig": {"defaults": {"min": 0, "max": 1}, "overrides": []},
     "options": {"legend": {"displayMode": "list", "placement": "bottom"}}}
  ]
}
The dashboard JSON model documentation explains the stored representation. Treat an exported dashboard as configuration that still needs review: it can contain environment-specific references or presentation settings that are irrelevant to the intended reusable example.
A stable UID helps preserve a dashboard’s identity and links. It does not make two independent dashboard definitions compatible. If two providers try to manage the same identity, resolve the ownership conflict rather than relying on whichever source happens to be applied last.
Check Grafana readiness and data source health
The harness first waits for Grafana’s health endpoint to report that its database is available. It then retrieves the dashboard and verifies its provisioning metadata and data source reference. Finally, it calls the data source health API and requires an OK result.
Check these stages in order: database readiness, dashboard provisioning, data source connectivity, and the panel query. Success at one stage does not establish success at the next. The data source HTTP API documents the health operation used here.
Use the same stages in deployment diagnostics. Report whether startup, provisioning, connectivity, authentication, or query execution failed, then include the corresponding API response. That gives the next engineer a concrete starting point.
Verify that API saves are rejected
The test authenticates as the disposable lab administrator and attempts to save the retrieved dashboard through the dashboard API. With the configured provider policy, Grafana returns HTTP 400 and a message that the provisioned dashboard cannot be saved.
The assertion checks both the status and the provisioning-related response. A failed request caused by missing credentials would not establish the intended ownership rule. Check the rejection message as well as the status code.
The dashboard HTTP API reference describes the versioned API surface. Grafana’s APIs evolve, so the lab records the release it tested. Re-run the fixture when upgrading rather than assuming an endpoint or error contract remains unchanged forever.
Update the file and retain the dashboard UID
The harness edits the temporary dashboard file’s title, then polls the retrieval API until the new title appears. It retrieves the dashboard by the same UID throughout the test. That verifies an update to the existing managed identity rather than the accidental creation of another dashboard.
The polling loop finishes when the new title appears or fails after its deadline. This checks the applied change despite variation in provisioning timing.
Extend this pattern to the fields your team depends on: data source references, query expressions, units, thresholds, and links. Be selective. Avoid asserting export fields your team does not rely on; harmless Grafana migrations may change them.
Configure access for the local lab
The lab enables anonymous Viewer access so its dashboard can be captured without distributing real credentials. Administrative API requests use a fixed disposable fixture password. The host binding is loopback, and the stack is removed after execution.
Those settings are part of the local experiment, not a production access-control recommendation. Grafana’s anonymous authentication documentation describes the associated role configuration. Review the real audience, network boundary, and information exposure before enabling anonymous access elsewhere.
Do not place production data source credentials into the dashboard JSON or commit them beside the provider. Use the configuration and secret-management approach appropriate to the deployment. The configuration reference is the starting point for supported settings; a local demonstration password should never become a reusable organizational credential.
Review the data available to Viewers
Preventing dashboard edits does not necessarily prevent users from seeing sensitive information exposed by its data source. Evaluate what data an authorized viewer can query and which organizational boundaries the Grafana instance is supposed to enforce.
The roles and permissions documentation describes the available permission model. Do not infer a tenant-isolation guarantee from editable: false or a read-only dashboard. Those settings express configuration ownership and editing behavior, not a complete data-access policy.
For the fixture, the data source contains only Prometheus’s local self-monitoring data. For production, identify credentials, accessible datasets, organization membership, and sharing settings as separate review items. A useful dashboard can still expose the wrong data to the wrong audience if those layers are not designed together.
Check what the dashboard actually measures
A valid dashboard can still mislead. The panel here displays a binary scrape result. It should not be labeled “customer availability” because it does not measure customer requests. Review the query’s meaning along with its JSON.
Check units, aggregation, time windows, and handling of missing data. Decide whether a panel should show an absent series as empty, unknown, or some explicitly derived value. A visually smooth chart is not evidence that those choices match the operational question.
Use dashboards to locate a symptom, then inspect the affected operations in traces or logs. Our OpenTelemetry tracing guide follows that investigation into application requests. Avoid giving a chart a broader claim than its underlying signal supports.
Release dashboards with their verification code
Keep the provider, data source, dashboard, and verification code in the same reviewed change. A dashboard-only change can fail because a UID changed elsewhere, while a data source-only change can affect many dashboards that still load successfully.
Before promotion, execute the fixture with the Grafana image selected for the deployment. Verify the source update behavior and the forbidden-write behavior, not just a screenshot of the initial render. Retain the captured version and test results with the review so a later upgrade has a clear comparison point.
Document the ownership policy where engineers find the dashboard. Our developer portal checklist discusses discoverability for operational resources. A short link to the source directory and contribution process can prevent emergency UI edits from becoming untracked long-term configuration.
Roll back the provisioning source
For file-owned dashboards, a rollback should restore the reviewed source definition and then verify the resulting Grafana state. Do not assume decreasing the dashboard JSON’s version field prevents a provisioning update. Grafana documents that provisioning can overwrite the database representation from the file regardless of that field’s relative value.
After a rollback, check that the dashboard UID remains the intended one, the data source reference resolves, the important query is restored, and the displayed units and thresholds match the previous release. A title reverting successfully is useful evidence of file application, but it does not verify every operationally important panel field.
Deletion needs its own policy. The fixture sets disableDeletion explicitly, which means removing a source file is not being demonstrated as a general cleanup workflow. Decide how retired dashboards should be identified and removed rather than leaving deletion behavior to an incidental provider default.
For larger repositories, map each managed dashboard to one owning directory or provider and keep UIDs unique within the intended organization. Review moves between providers as ownership changes, not cosmetic file renames. A provider move can otherwise leave an old copy or two sources managing the same UID. Use the API checks to verify the destination provider after a move.
Frequently asked questions
Why does Grafana report “Cannot save provisioned dashboard”?
The file provider disallows UI updates with allowUiUpdates: false. In the tested Grafana 12.1.1 configuration, an authenticated save through the dashboard API returns HTTP 400 with that message. Edit the provisioning source and verify the resulting dashboard instead. A request rejected for missing credentials would indicate a different problem and would not test this ownership policy.
Can Grafana overwrite changes saved through the UI?
Yes. If UI updates are allowed, later changes to the provisioning file can overwrite the database version. Grafana also ignores the dashboard JSON’s relative version value when applying that file. Decide where changes should be maintained, and verify rollback by inspecting the resulting dashboard rather than relying on a lower version number to block an update.
Why are dashboard and data source UIDs both specified?
The dashboard UID identifies the dashboard; the data source UID identifies the connection referenced by its panel. Keeping both stable lets the test retrieve the same dashboard after a source change and verify its data source reference. A stable dashboard UID cannot repair a panel that points to a missing or incorrect data source UID.
Why might a mounted dashboard file take time to update?
Grafana’s provider detects file changes asynchronously. The fixture sets updateIntervalSeconds to 15, which uses polling, and waits until the API returns the changed title. File-event behavior can differ across mounts at shorter intervals. Check the provider path and detection settings before treating a delayed update as proof that the JSON was rejected.