
Developer Tooling
Prometheus alert rule testing for latency SLOs

Use promtool test rules to check when a Prometheus alert fires and what happens when its inputs reset, disappear, or stop increasing. A rule can parse correctly while reporting the wrong latency ratio or never firing for missing data. Synthetic time series let you test those cases before connecting the rule to paging.
The example measures requests above 300 milliseconds against a 99.9-percent latency objective. With Prometheus 3.5.0, it checks sustained slow traffic, pending and firing states, zero traffic, missing metrics, a failed scrape, and counter resets. The code evaluates a chosen alert policy rather than measuring a live service’s SLO. That makes the expected values reproducible and keeps instrumentation and notification checks separate.
The Prometheus example and test runner are available with the recorded results.
Run promtool without a Prometheus server
Before you start:
- Install Python 3.11 or newer, Git, and Docker. Confirm the Docker engine is running with
docker info. - Run the commands from the repository root after cloning. The examples use pinned container versions and download them on the first run.
- Use a local development machine with room for disposable containers. The harness removes the resources it creates.
The repository contains the rule file and synthetic time-series fixtures. The harness mounts the files read-only into the Prometheus image and invokes promtool test rules.
git clone https://github.com/emminextechdocs/developer-examples.git
cd developer-examples
python3 deep-dives/walkthrough.py prometheus
The unit test does not need a running Prometheus server. After cloning the repository, you can also invoke the pinned promtool directly:
docker run --rm -v "$PWD/deep-dives/prometheus:/work:ro" -w /work \
  --entrypoint /bin/promtool prom/prometheus:v3.5.0 test rules tests.yml
The bind mount supplies rules.yml and tests.yml; -w /work makes their relative paths resolve inside the container. A passing run prints SUCCESS. A failing fixture reports the mismatched expression or alert expectation and exits nonzero. Keep this command in CI so a valid YAML edit cannot silently change the alert’s behavior.
A successful run records the tool’s result in deep-dives/evidence/prometheus.json. The official rule-testing documentation defines the fixture format, evaluation times, and expected alerts. These tests evaluate the rules against supplied samples; they do not validate a live scrape endpoint or notification route.

walkthrough.py runs the lab and prints selected commands and their responses alongside the assertions. Open the full-resolution capture.
Calculate latency error-budget burn
The objective counts requests at or below 0.3 seconds as good. Everything above that boundary is slow for this particular objective. We use a classic histogram’s cumulative le="0.3" bucket and total count to estimate the slow fraction over five minutes.
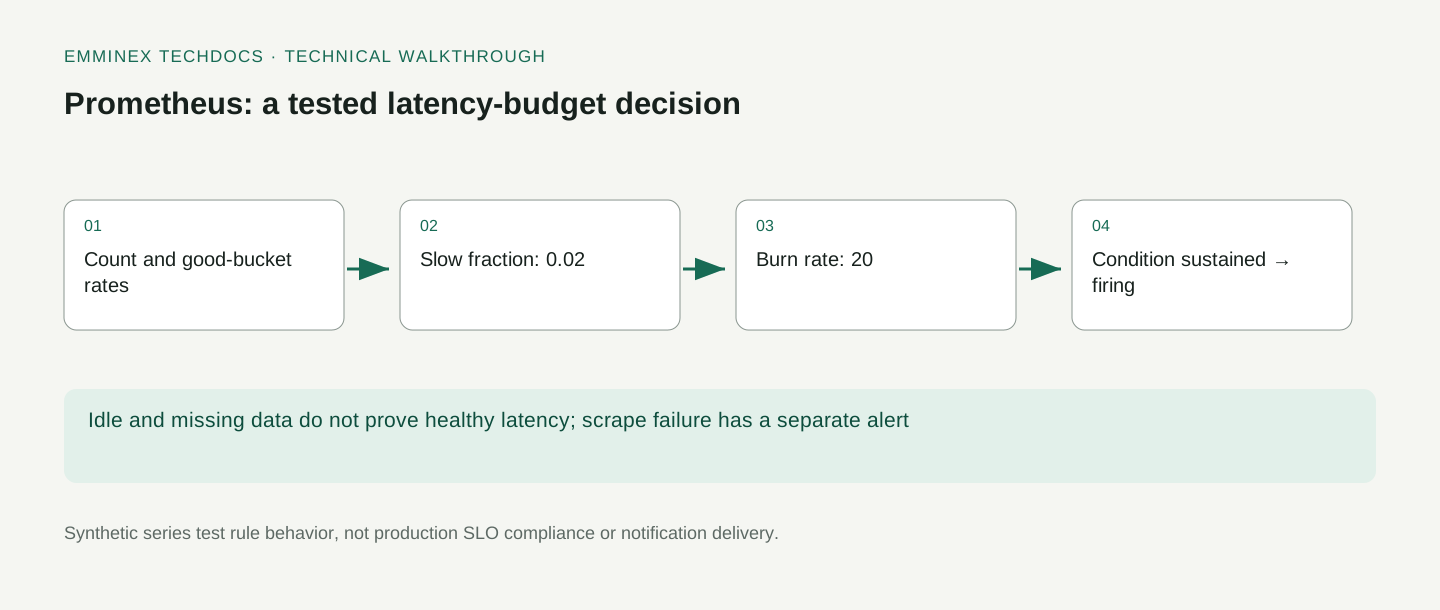
Subtract the good request rate from the total request rate, then divide by the total to obtain the slow fraction. Dividing that fraction by 0.001 expresses how quickly it consumes a 0.1-percent error budget. A two-percent slow fraction therefore corresponds to a burn rate of twenty.
This is an example policy, not an externally mandated SLO. Decide whether failed requests, cancellations, or excluded endpoints belong in your own objective before adopting the formula. Prometheus’s histogram guidance explains cumulative buckets and the distinction between threshold calculations and quantile estimates.
Expose the 300-millisecond histogram bucket
The expression requires an actual bucket boundary at 0.3 seconds. It cannot recover an exact 300-millisecond fraction from an arbitrary nearby bucket. If the exporter does not expose that boundary, change the instrumentation or define the resulting approximation explicitly.
Units matter just as much. The metric name says seconds, and the bucket label is 0.3. Treating a millisecond-valued measurement as seconds would produce an expression that parses successfully while answering the wrong question. Unit and label checks belong in exporter tests and operational review.
Keep metric dimensions bounded. service is the aggregation boundary in this example; individual request IDs would create a different series for each request. The instrumentation practices discuss labels and cardinality. Use traces or logs for individual request investigation instead of turning every request into a metric label.
Apply rate before summing counters
The rules calculate rate on each underlying counter series and then sum by service. This lets rate handle each instance’s counter resets before aggregation removes the instance labels.
groups:
  - name: checkout-latency
    rules:
      - record: service:requests:rate5m
        expr: sum by (service) (rate(http_request_duration_seconds_count[5m]))
      - record: service:slow_requests:ratio5m
        expr: |
          (service:requests:rate5m - sum by (service) (rate(http_request_duration_seconds_bucket{le="0.3"}[5m])))
          / service:requests:rate5m
      - alert: CheckoutLatencyBudgetBurn
        expr: service:slow_requests:ratio5m / 0.001 > 14.4 and on (service) service:requests:rate5m > 1
        for: 2m
        labels:
          severity: page
        annotations:
          summary: Slow checkout requests are consuming the latency budget
      - alert: ScrapeTargetDown
        expr: up{job="checkout"} == 0
        for: 1m
        labels:
          severity: warning
Follow the calculation in order:
rateconverts each cumulative counter into a per-second rate before aggregation.- Subtracting the 300ms bucket rate from the total rate gives the slow-request rate.
- Dividing by total traffic gives the slow fraction; dividing again by
0.001gives budget burn. - The traffic guard and
for: 2mdecide whether the alert should become firing.
The query-function reference documents rate, counter-reset handling, and extrapolation. Treat the resulting value as an estimate over the selected range, not a literal count of events observed at every point in wall-clock time.
The recording rules let operators inspect the request rate and slow fraction independently of the alert. Keep other intermediate expressions inline unless they are useful for debugging or reuse.
Order dependent recording rules
The recording rules and alert are in one group in the order shown. The alert refers to the recorded request rate and slow fraction. If you move the rules into different groups or change evaluation intervals, re-evaluate the timing assumptions in the tests.
Prometheus’s recording-rule documentation describes evaluation and recording behavior. A refactor that preserves an expression’s text can still change when its inputs become available. Treat group structure as part of the configuration being reviewed.
Use names that expose both aggregation and time range. The fixture’s service:requests:rate5m is intentionally more descriptive than request_rate. Naming cannot establish correctness, but it helps reviewers notice when a dashboard or alert combines series computed over incompatible windows.
Test pending and firing states
The alert requires a burn rate above 14.4 and a request rate above one request per second, sustained through a two-minute for period. The traffic threshold is an example policy to avoid paging on tiny populations; it is not part of Prometheus’s definition of an SLO.
The fixture supplies counters increasing at 100 requests per second, of which 98 per second fall within the good bucket. It expects no firing alert at one minute and a firing alert later. The expected labels and annotation are checked too, so a routing-label regression can fail the test even if the expression still becomes true.
The alerting-rule documentation defines the pending and firing states. A true expression does not immediately imply a firing alert when for is configured. Conversely, a rule test showing a firing state does not prove an Alertmanager receiver was contacted.
Read the rule-test fixtures
Each fixture isolates one question. The high-latency case verifies the ratio and eventual alert. The idle case verifies that no latency page fires. The missing-data case demonstrates absence. The scrape-failure case exercises an independent alert, and the reset case checks a counter discontinuity.
rule_files: [rules.yml]
evaluation_interval: 1m
tests:
  - name: sustained two-percent slow traffic fires after pending period
    interval: 1m
    input_series:
      - series: 'http_request_duration_seconds_count{service="checkout",instance="a"}'
        values: '0+6000x10'
      - series: 'http_request_duration_seconds_bucket{service="checkout",instance="a",le="0.3"}'
        values: '0+5880x10'
    alert_rule_test:
      - eval_time: 1m
        alertname: CheckoutLatencyBudgetBurn
        exp_alerts: []
      - eval_time: 5m
        alertname: CheckoutLatencyBudgetBurn
        exp_alerts:
          - exp_labels: {service: checkout, severity: page}
            exp_annotations: {summary: Slow checkout requests are consuming the latency budget}
    promql_expr_test:
      - expr: service:slow_requests:ratio5m
        eval_time: 5m
        exp_samples:
          - labels: '{__name__="service:slow_requests:ratio5m",service="checkout"}'
            value: 0.02
  - name: idle service does not page for latency
    interval: 1m
    input_series:
      - series: 'http_request_duration_seconds_count{service="checkout"}'
        values: '0+0x10'
      - series: 'http_request_duration_seconds_bucket{service="checkout",le="0.3"}'
        values: '0+0x10'
    alert_rule_test:
      - eval_time: 5m
        alertname: CheckoutLatencyBudgetBurn
        exp_alerts: []
  - name: missing metrics are not automatically a latency breach
    input_series: []
    alert_rule_test:
      - eval_time: 5m
        alertname: CheckoutLatencyBudgetBurn
        exp_alerts: []
  - name: known failed scrape has its own alert
    input_series:
      - series: 'up{job="checkout",instance="a"}'
        values: '0+0x10'
    alert_rule_test:
      - eval_time: 2m
        alertname: ScrapeTargetDown
        exp_alerts:
          - exp_labels: {job: checkout, instance: a, severity: warning}
  - name: a counter reset remains measurable
    interval: 1m
    input_series:
      - series: 'http_request_duration_seconds_count{service="checkout"}'
        values: '0 6000 0 6000 12000 18000'
      - series: 'http_request_duration_seconds_bucket{service="checkout",le="0.3"}'
        values: '0 5880 0 5880 11760 17640'
    promql_expr_test:
      - expr: resets(http_request_duration_seconds_count[5m])
        eval_time: 5m
        exp_samples:
          - labels: '{service="checkout"}'
            value: 1
      - expr: service:slow_requests:ratio5m
        eval_time: 5m
        exp_samples:
          - labels: '{__name__="service:slow_requests:ratio5m",service="checkout"}'
            value: 0.02
The expanding sample notation keeps the fixture short enough to review. For example, a starting value plus a repeated increment represents a synthetic counter sequence. Evaluation times are relative to the fixture, not dates from the host running the test.
The synthetic samples give the calculations repeatable inputs. Their known increments make a wrong ratio or alert time easier to detect than a large recording of production traffic. Add cases matching your scrape intervals, gaps, and exporter behavior.
Handle zero traffic explicitly
When total traffic is zero, the latency ratio does not provide a meaningful observed success fraction. The fixture verifies that this does not fire the latency alert. The minimum-traffic condition is part of the example’s paging policy, while the underlying division still needs to be understood.
Do not replace every missing or undefined ratio with zero and then describe the service as healthy. “No measured requests” and “all measured requests were fast” are different observations. They may need different dashboard text and different operational responses.
PromQL’s operator documentation explains filtering and vector matching. The and on(service) clause combines conditions using the intended service label. If you add tenant or route dimensions, inspect the matching rules again; an expression can silently drop series when label sets no longer align.
Detect missing metrics and failed scrapes separately
The missing-metrics fixture produces no latency alert. This exposes a gap in coverage. If the histogram disappears, this expression cannot infer how many slow requests occurred.
The separate ScrapeTargetDown alert checks an existing up series equal to zero. That detects a known target whose scrape fails. It does not automatically detect a target removed from service discovery, because the relevant series can disappear altogether. Review query staleness and selector behavior when defining absence detection.
Choose an inventory or expectation against which missing telemetry can be judged. A static list, service registry, or independently maintained expected-target metric can support that design. The correct source depends on your platform. Avoid presenting an absence expression without explaining which entity should have existed and for how long.
Check the ratio after a counter reset
The reset fixture moves both histogram counters backward to simulate a restart, then resumes their increments. It checks that resets observes one reset and that the calculated slow fraction remains two percent for the supplied sequence.
The result applies to the supplied sequence; other scrape gaps, reset timings, and short ranges can change the estimate. Add those cases if your alert is sensitive to sparse samples or frequent restarts.
Keep the assertion about the ratio alongside the reset-count assertion. Merely proving that a reset occurred does not prove the alert handled it correctly. Likewise, checking only that the rule did not throw an error would miss a numerically wrong result that still looks plausible in a dashboard.
Step through the same rule in a live Prometheus UI
Start the Docker Compose v2 companion from the repository root:
docker compose -p emminex-observe -f deep-dives/observability/compose.yml up -dmetrics.py exposes synthetic histogram counters at about 100 observations per second, with about 98% inside the 300ms bucket. It follows the Prometheus text exposition format. These generated observations make the rule visible; they are not measured checkout traffic or a load test.
- Open
http://127.0.0.1:19090and select Query. - Evaluate
service:slow_requests:ratio5mafter the first scrapes and rule evaluations. The value should settle near0.02. - Evaluate
service:slow_requests:ratio5m / 0.001. The result should be near20, above the fixture’s threshold of14.4. - Open Alerts. Wait until the expression has remained true for two minutes. CheckoutLatencyBudgetBurn should become firing.
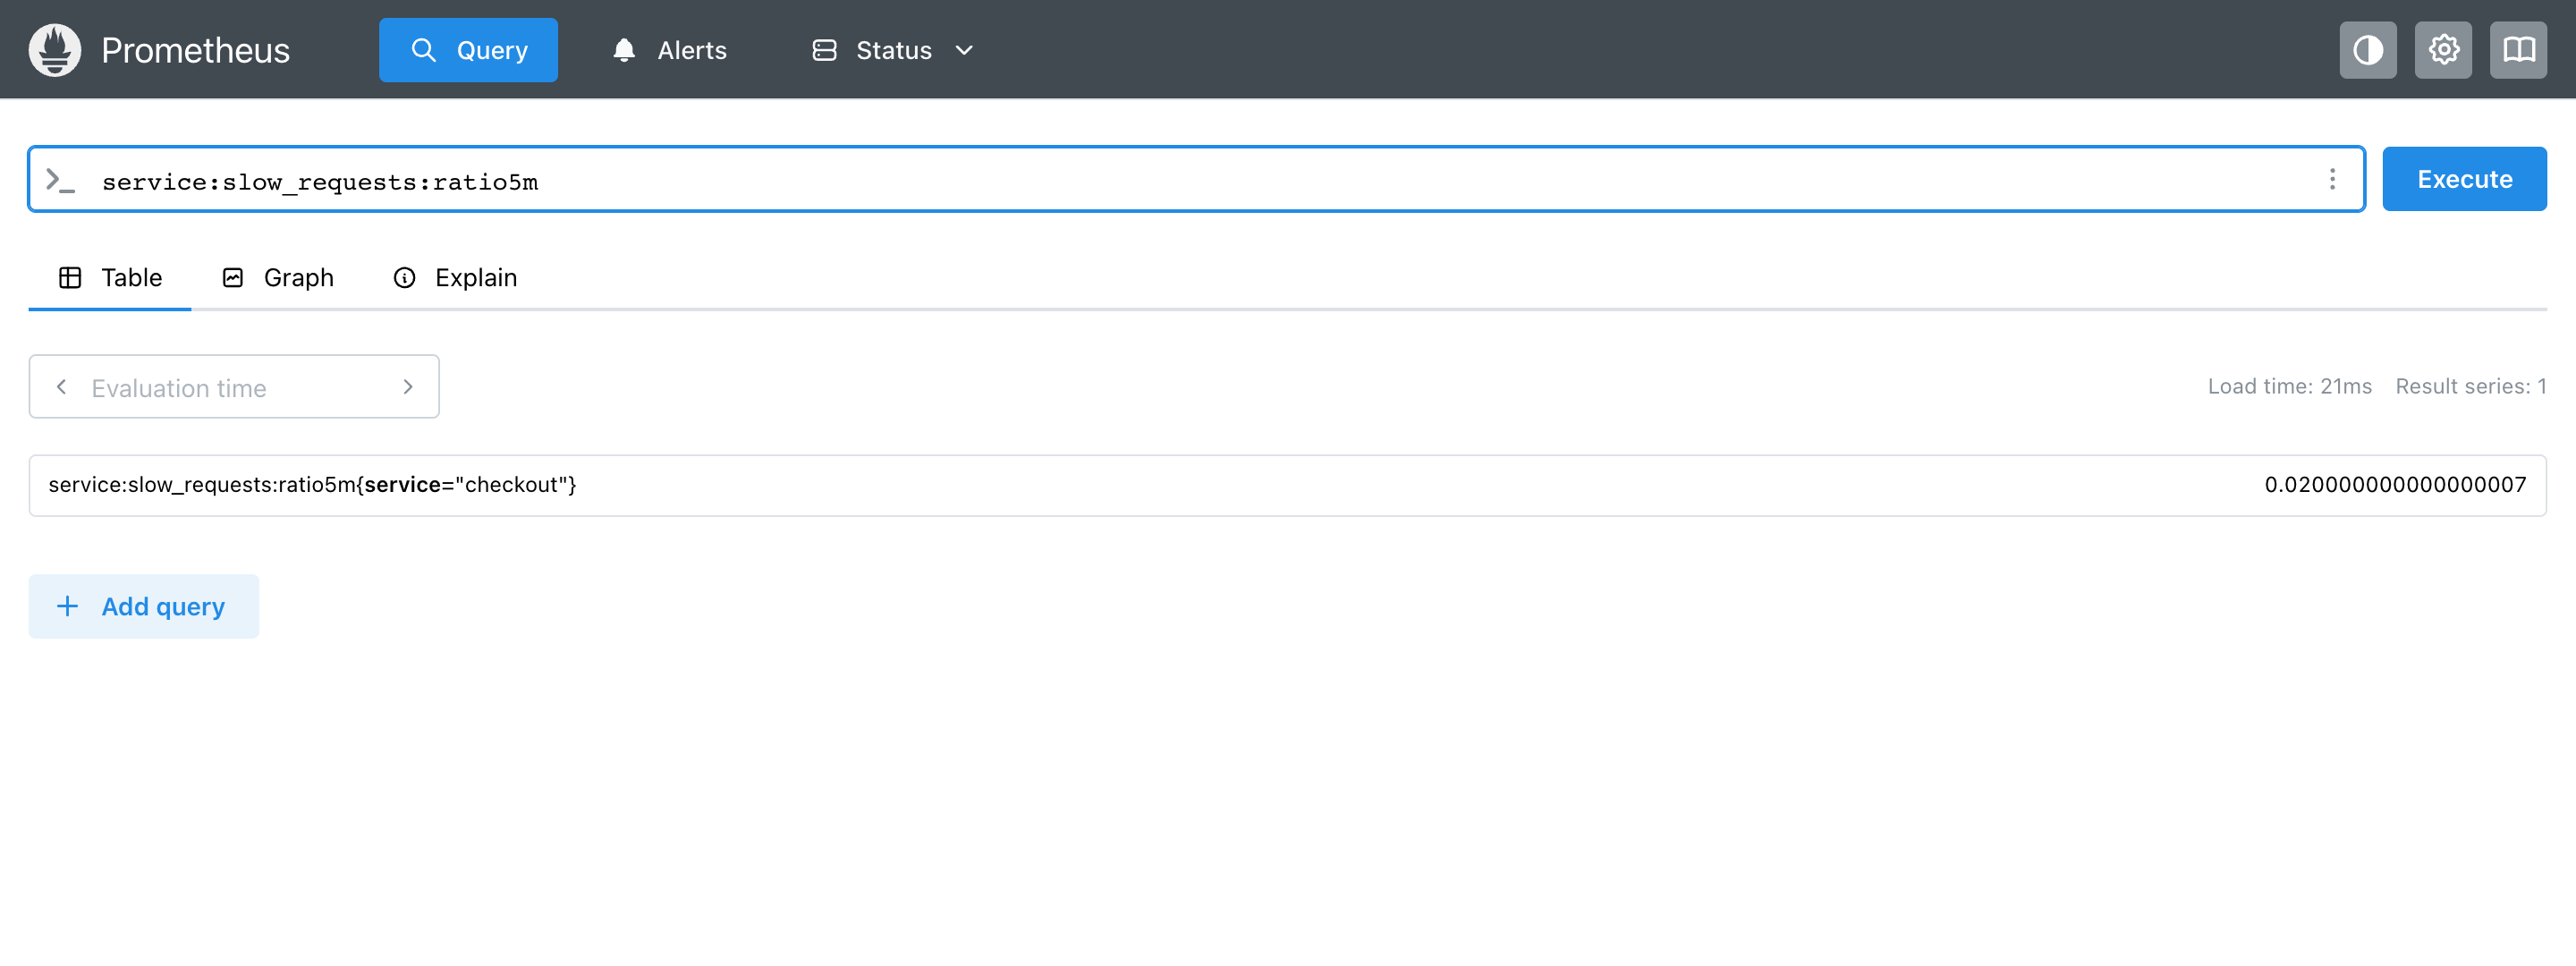
If the query returns no series, inspect Status → Target health and confirm that checkout is up. If it has data but the alert stays pending, inspect its active time before changing for. Five-second scrapes and evaluations do not remove the two-minute pending requirement.
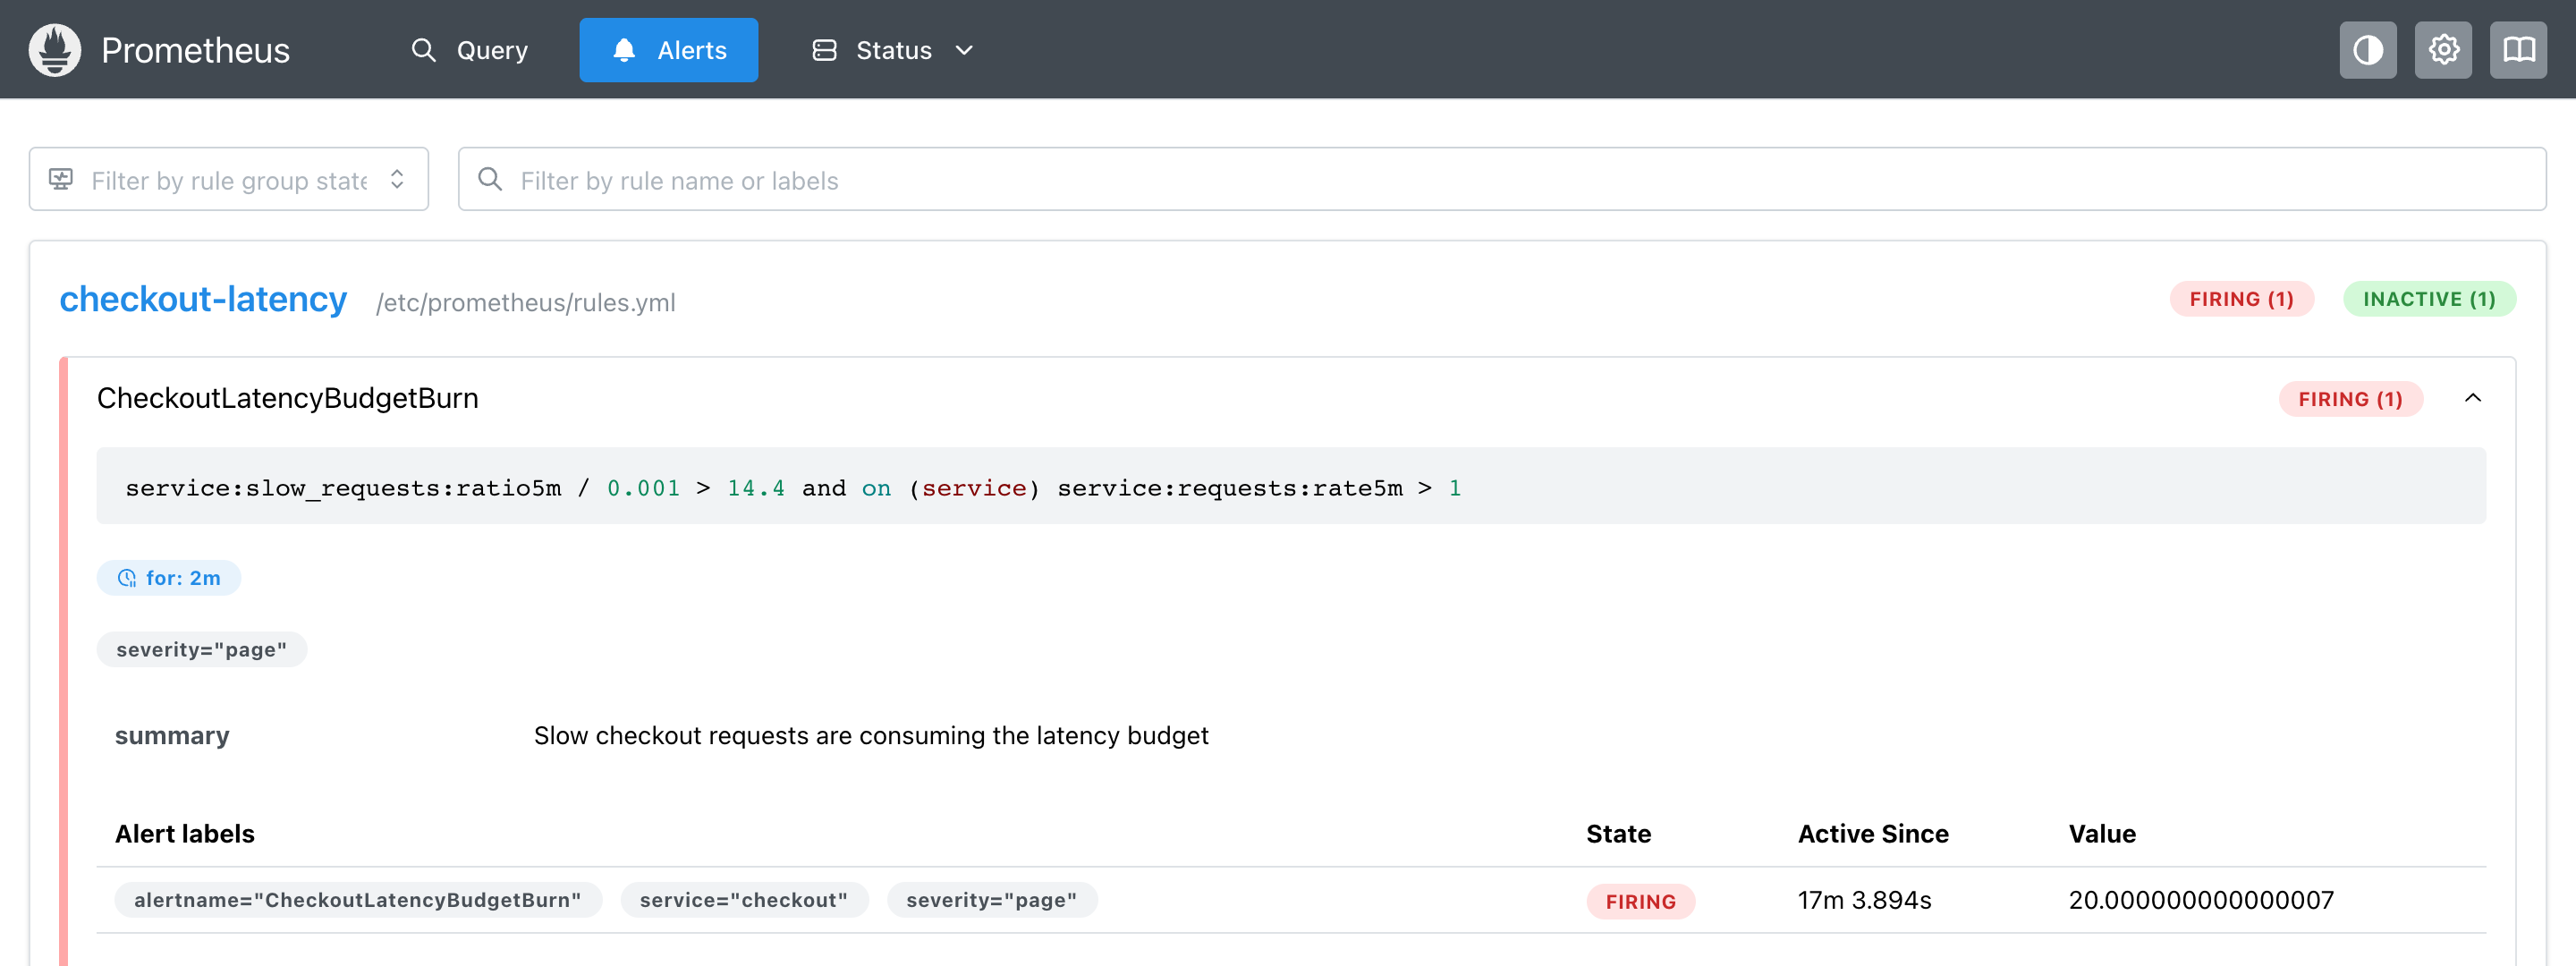
This companion has no Alertmanager, so the firing state does not send a notification. When finished, run:
docker compose -p emminex-observe -f deep-dives/observability/compose.yml down -vDefine the limits of a single-window alert
This example uses one five-minute observation window and a pending duration. A production policy also needs decisions about longer-term budget accounting, multiple windows, routing, inhibition, and maintenance.
Do not call the rule a guarantee that an entire reporting period’s objective is met. The expression observes recent samples under a chosen policy. Its value can guide response, but long-term compliance needs an explicitly defined measurement period and data treatment.
Use the test suite to compare proposed policies with the same fixtures. Add a short spike, sustained degradation, recovery, and low-volume traffic before deciding whether a rule is too noisy or too slow. Our developer portal checklist is useful when documenting those operational expectations for application teams.
Verify deployed rules and notification routing
Passing promtool should be one release check. Also confirm that the deployed server loaded the intended rule version, that the exporter exposes the expected bucket and labels, and that notification routing matches the alert’s labels. Check each stage independently so a failed notification can be traced to its cause.
Keep the rule, fixtures, and review notes in version control. When changing the threshold or for duration, update the tests in the same change and explain the desired operational effect. A passing test whose expectations were changed without discussion is not independent evidence that the policy improved.
For request-level investigation after a page, connect metrics to traces or logs. Our OpenTelemetry tracing guide provides that next layer. Metrics can identify a service-level symptom; they do not replace the evidence needed to explain an individual slow request.
Keep alert labels stable during the pending period
An alert instance is associated with its label set. Keep labels used for identity stable across evaluations. A label derived from a changing measured value can make an apparently continuous problem look like a sequence of different alert instances, undermining the intended pending behavior. Put changing explanatory values in annotations when that matches the operational need, and verify the resulting labels in the fixture.
The example checks service and severity rather than merely expecting an alert with the correct name. That protects the fields a routing policy or operator may rely on. When adding an environment, cluster, or team label, update the expected identity deliberately and inspect whether aggregation preserves it.
A useful next fixture is recovery after firing. Supply a sustained bad interval, then a good interval long enough to change the rate window, and assert when the alert stops firing. This tests when the alert clears. The observation window can keep old bad samples relevant after the instantaneous traffic pattern improves.
Test notification behavior separately. Grouping, inhibition, silences, and repeat intervals can change what a person receives even when the Prometheus alert state is correct. Keep the current unit test focused on rule semantics, and add an independently scoped integration test for the notification path your team actually uses.
Frequently asked questions
How do you test Prometheus alert rules locally?
Create a rule file and a test file containing input series, evaluation times, and expected alerts, then run promtool test rules. This repository’s Docker-backed command runs that check with Prometheus 3.5.0. Include the labels you depend on in expected results, and test both when an alert should fire and when it should remain inactive.
Why does the rule use a histogram bucket instead of p99?
The objective asks what fraction of requests finish within 300 milliseconds. A classic histogram bucket at le="0.3" counts those requests directly; the total count supplies the denominator. A p99 calculation answers a different question. Verify that the application measures seconds and actually exports the required bucket before relying on the threshold fraction.
Why does an alert stay pending even when the expression is true?
A configured for duration requires the alert instance to remain active across evaluations before it fires. The test checks this waiting period explicitly. Its labels must remain stable too: changing a label value changes the alert instance. Use annotations for changing explanatory values, and verify the final label set alongside the alert name.
Does up == 0 detect every missing Prometheus target?
No. It detects a known target with a failed scrape while the relevant series exists. A target removed from discovery can disappear from the data instead. Define which targets should exist and test absence detection against that expectation. The supplied missing-metrics case documents the latency rule’s silence; it does not turn missing measurements into healthy traffic.