
Developer Tooling
OpenTelemetry Node.js Tutorial: Traces, Metrics, and Logs
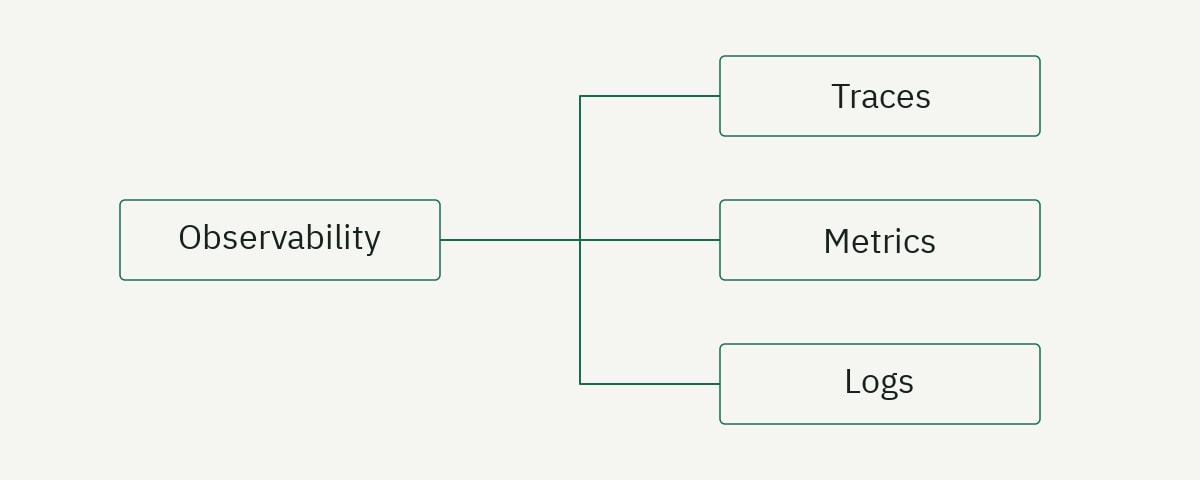
An effective OpenTelemetry setup for Node.js initializes the SDK before application modules load, enables automatic instrumentation for common libraries, exports signals through OTLP, and adds a small number of domain-specific spans and metrics. The goal is not to collect everything. It is to make important requests explainable without creating unsafe attributes or an unmanageable telemetry bill.
This tutorial instruments a small Express API, sends traces and metrics to an OpenTelemetry Collector, and shows how to validate context propagation and failures. It targets Node.js 22 or newer and the JavaScript OpenTelemetry documentation available in September 2026. Package APIs change, so compare the imports with the official JavaScript getting-started guide when implementing the example.
Decide what the telemetry must answer
Instrumentation becomes noisy when a team starts with packages instead of questions. Write down the operational questions before writing code. For an order API, useful questions might be:
- Which route is contributing most to p95 latency?
- Where does a slow request spend its time?
- Are failures caused by validation, the database, or a payment provider?
- How many orders enter each outcome?
- Did a deploy change error rate or queue delay?
Traces explain the path of individual operations. Metrics summarize behavior over time. Logs preserve discrete events and diagnostic details. The signals are complementary. A metric alert can identify a regression, a trace can locate the slow dependency, and a correlated log can explain the domain failure.
Avoid turning every field into telemetry. Customer email addresses, access tokens, request bodies, and arbitrary query strings are dangerous. Highly variable values such as order IDs also create high cardinality when used as metric attributes. Establish an attribute policy before rollout: approved keys, prohibited data, naming rules, and expected cardinality.
The OpenTelemetry semantic conventions provide shared names for common protocols and operations. Use them where automatic instrumentation already applies them. Reserve custom attributes for domain concepts that answer a real question.
Create the Node.js service
Create a project and install Express plus the OpenTelemetry SDK, automatic instrumentations, and OTLP exporters:
mkdir otel-orders-api
cd otel-orders-api
npm init -y
npm install express
npm install @opentelemetry/api @opentelemetry/sdk-node
npm install @opentelemetry/auto-instrumentations-node
npm install @opentelemetry/exporter-trace-otlp-http
npm install @opentelemetry/exporter-metrics-otlp-http
npm install @opentelemetry/sdk-metrics @opentelemetry/resources
npm install @opentelemetry/semantic-conventions
npm install --save-dev typescript @types/express @types/node
Configure the package as an ES module and add scripts that preload instrumentation:
{
  "type": "module",
  "scripts": {
    "build": "tsc -p tsconfig.json",
    "start": "node --import ./dist/instrumentation.js ./dist/app.js",
    "check": "tsc -p tsconfig.json --noEmit"
  }
}
The preload order matters. If Express, http, or a database client loads before its instrumentation patches the module, spans may be missing. Keeping telemetry bootstrap code separate from the application also makes it possible to disable or replace exporting without touching route logic.
Create a strict tsconfig.json targeting a modern Node runtime. Compile src into dist, use NodeNext module resolution, and include Node types. The exact configuration is less important than ensuring the instrumentation module and app compile to the paths referenced by the start script.
Start the OpenTelemetry SDK first
Create src/instrumentation.ts:
import { NodeSDK } from '@opentelemetry/sdk-node';
import { getNodeAutoInstrumentations } from '@opentelemetry/auto-instrumentations-node';
import { OTLPTraceExporter } from '@opentelemetry/exporter-trace-otlp-http';
import { OTLPMetricExporter } from '@opentelemetry/exporter-metrics-otlp-http';
import { PeriodicExportingMetricReader } from '@opentelemetry/sdk-metrics';
import { resourceFromAttributes } from '@opentelemetry/resources';
import { ATTR_SERVICE_NAME, ATTR_SERVICE_VERSION } from '@opentelemetry/semantic-conventions';

const sdk = new NodeSDK({
  resource: resourceFromAttributes({
    [ATTR_SERVICE_NAME]: process.env.OTEL_SERVICE_NAME ?? 'orders-api',
    [ATTR_SERVICE_VERSION]: process.env.APP_VERSION ?? 'dev'
  }),
  traceExporter: new OTLPTraceExporter(),
  metricReader: new PeriodicExportingMetricReader({
    exporter: new OTLPMetricExporter(),
    exportIntervalMillis: 10_000
  }),
  instrumentations: [getNodeAutoInstrumentations()]
});

await sdk.start();

async function shutdown(signal: string) {
  try {
    await sdk.shutdown();
    console.error(`telemetry flushed after ${signal}`);
  } finally {
    process.exit(0);
  }
}

process.once('SIGTERM', () => void shutdown('SIGTERM'));
process.once('SIGINT', () => void shutdown('SIGINT'));
The resource identifies the process that produced the telemetry. Keep service.name stable across instances, and put changing identifiers such as version, deployment environment, or region in their own resource attributes. Do not encode the host name or pod ID into the service name.
Graceful shutdown matters for batch exporters. A container may otherwise exit before buffered spans reach the collector. Your orchestrator’s termination grace period must be longer than the exporter’s final flush path.
OTLP exporters read standard environment variables. A local configuration can point both HTTP exporters at a collector:
export OTEL_SERVICE_NAME=orders-api
export OTEL_EXPORTER_OTLP_ENDPOINT=http://127.0.0.1:4318
export OTEL_RESOURCE_ATTRIBUTES=deployment.environment.name=local
npm run start
Do not hard-code production collector credentials or endpoints into the bundle. Environment configuration makes the artifact portable and keeps secrets out of source control.
Run a local OpenTelemetry Collector
The Collector decouples applications from observability backends. It can receive OTLP, batch data, remove attributes, enrich resources, sample traces, and export to one or more destinations. It also gives applications one stable target when a vendor changes.
Create otel-collector.yaml:
receivers:
  otlp:
    protocols:
      grpc:
      http:

processors:
  memory_limiter:
    check_interval: 1s
    limit_mib: 256
  batch:

exporters:
  debug:
    verbosity: detailed

service:
  pipelines:
    traces:
      receivers: [otlp]
      processors: [memory_limiter, batch]
      exporters: [debug]
    metrics:
      receivers: [otlp]
      processors: [memory_limiter, batch]
      exporters: [debug]
Run the official Collector image with the configuration mounted into the container:
docker run --rm \
  -p 4317:4317 -p 4318:4318 \
  -v "$PWD/otel-collector.yaml:/etc/otelcol/config.yaml:ro" \
  otel/opentelemetry-collector:0.160.0
The example pins the Collector version in the official quick start when this article was reviewed. Update the tag deliberately after checking the release notes and rerunning the signal-path test. The Collector installation guide and configuration reference document the image and pipeline structure.
The debug exporter is intentionally local. It lets you prove that the collector receives data before introducing a backend, credentials, or network policy. Replace it with your selected exporter only after the local path works.
Add automatic and manual instrumentation
Create src/app.ts:
import express from 'express';
import { metrics, SpanStatusCode, trace } from '@opentelemetry/api';

const app = express();
app.use(express.json({ limit: '32kb' }));

const tracer = trace.getTracer('orders-domain');
const meter = metrics.getMeter('orders-domain');
const orderCounter = meter.createCounter('orders.created', {
  description: 'Number of accepted orders'
});

app.post('/orders', async (request, response) => {
  const result = await tracer.startActiveSpan('validate and create order', async (span) => {
    try {
      const itemCount = Array.isArray(request.body?.items) ? request.body.items.length : 0;
      span.setAttribute('order.item_count', itemCount);

      if (itemCount === 0) {
        span.setStatus({ code: SpanStatusCode.ERROR, message: 'empty order' });
        return { status: 400, body: { error: 'items are required' } };
      }

      await new Promise((resolve) => setTimeout(resolve, 25));
      orderCounter.add(1, { 'order.channel': 'api' });
      return { status: 201, body: { status: 'accepted' } };
    } catch (error) {
      span.recordException(error as Error);
      span.setStatus({ code: SpanStatusCode.ERROR });
      throw error;
    } finally {
      span.end();
    }
  });

  response.status(result.status).json(result.body);
});

app.listen(3000, () => console.log('orders API listening on :3000'));
Automatic instrumentation should already create inbound HTTP and Express spans. The manual span captures a meaningful domain operation inside the route. This is a better name than repeating POST /orders, because it explains what the code is attempting.
The metric uses a bounded order.channel value. Do not attach the order ID, user ID, error message, or URL as metric attributes. Every unique combination can create another time series. Traces can carry selected high-cardinality diagnostic fields when policy allows, but even trace attributes should avoid sensitive data.
Propagate context across services
Distributed tracing works only when trace context follows the request. Supported HTTP instrumentation injects and extracts W3C Trace Context headers automatically. When you publish to a queue, call an unsupported client, or cross a custom protocol, you may need explicit propagation.
Do not create a new root span for every downstream call. Use the active context so the trace retains its parent-child relationship. When work becomes asynchronous, decide whether a consumer span is a child of the producer or linked to it. A child relationship suits a single handoff; links are often clearer for batches, retries, or fan-out.
Propagate only through trusted boundaries. Trace headers are not authentication. An external caller can send a valid-looking trace ID, but your application must still authenticate the request. Configure the edge so untrusted baggage cannot inject arbitrary attributes into internal telemetry.
For background jobs, include a stable job type and outcome, not an unbounded queue payload. Record retry count as a number and failure category as a controlled enum. Keep the raw stack trace in a correlated log or exception event rather than a metric label.
Instrument databases and asynchronous work deliberately
Automatic database instrumentation can show operation type, system, duration, and connection behavior without exposing full query values. Review its defaults before production. Raw SQL statements may contain literals or reveal schema details, while normalized operation names often answer the performance question with less risk.
Add manual spans around business-level boundaries the driver cannot understand: reserving inventory, evaluating access, or waiting for a job result. Do not wrap every function. A trace with thousands of tiny spans is slower to inspect and more expensive to retain.
For queues, record publish and process spans with message-system semantic attributes supported by your instrumentation. Avoid message bodies, user data, and unbounded destination names. Capture queue delay as the difference between a trusted enqueue timestamp and processing start, then expose a bounded histogram for alerting.
Retries deserve events or attributes that distinguish attempts without creating separate unrelated traces. Preserve the original relationship with context or links, record the retry cause as a controlled category, and ensure one poison message cannot generate unlimited telemetry. Operational limits must apply to instrumentation as well as work.
Correlate structured logs with traces
Node.js logging support and package maturity can differ from traces and metrics, so check current OpenTelemetry JavaScript signal status before choosing an SDK path. Even without a log exporter, you can include active trace identifiers in structured application logs.
import { context, trace } from '@opentelemetry/api';

export function log(event: string, fields: Record<string, unknown> = {}) {
  const spanContext = trace.getSpan(context.active())?.spanContext();
  console.log(JSON.stringify({
    timestamp: new Date().toISOString(),
    event,
    trace_id: spanContext?.traceId,
    span_id: spanContext?.spanId,
    ...fields
  }));
}
Call this function inside an active request or span. Your log backend can make trace_id searchable, while your trace backend may support a direct logs link. Preserve one naming convention end to end. A field named traceId in one service and trace_id in another creates avoidable query friction.
Redact before logging. Central collection increases the blast radius of a mistake. Define allow-listed fields where possible, cap message sizes, and set retention according to the data classification rather than the storage system’s default.
Control sampling, cost, and cardinality
Head sampling decides near the start of a trace whether to record it. It is efficient but cannot know the final outcome. Tail sampling occurs in a collector after spans arrive and can retain slow or failed traces, but it requires more collector memory and a topology that keeps each trace’s spans together.
Begin with a documented sample rate and retain errors through an appropriate collector policy if the environment needs it. Sampling decisions must be propagated; independent decisions in every service fragment traces. Measure collector drops and exporter failures so an observability outage does not remain invisible.
Cardinality deserves the same attention as sampling. Review every metric attribute against a finite list. Route templates such as /users/:id are safe; raw paths such as /users/95817 are not. Status-code classes may be enough for dashboards, while full codes remain acceptable if the set is bounded.
Apply memory limits and batches in the collector, and set application export timeouts. Observability must not turn a backend slowdown into an application outage. Decide whether exporter failures are dropped, retried, or buffered, and place hard bounds on every queue.
Verify the complete signal path
Start the collector, build the service, and send successful and failing requests:
npm run build
npm run start

curl -i -X POST http://127.0.0.1:3000/orders \
  -H 'content-type: application/json' \
  -d '{"items":[{"sku":"DOCS-1","quantity":1}]}'

curl -i -X POST http://127.0.0.1:3000/orders \
  -H 'content-type: application/json' \
  -d '{"items":[]}'
Confirm five things in the collector output: the service resource is correct, the HTTP server span exists, the manual domain span has the expected parent, the error request has an error status, and the counter exports with a bounded attribute. Wait at least one metric export interval before concluding that metrics are missing.
Then test shutdown. Send SIGTERM and confirm the SDK flushes. Stop the collector and observe how the application behaves when exporting fails. Telemetry failures should be visible in diagnostics but should not prevent the API from serving normal requests.
Automate a smoke test in CI or a preproduction environment. Package-level unit tests cannot prove that preload ordering, environment variables, collector configuration, and backend credentials work together. Our developer portal checklist includes related guidance for documenting operational expectations and troubleshooting paths.
Troubleshoot missing or misleading telemetry
When all spans are missing, check whether the instrumentation module loaded before the application, whether the OTLP endpoint includes the correct protocol and port, and whether the collector receiver is enabled. Increase diagnostic verbosity temporarily, but do not leave debug logging enabled at production volume.
When only a library’s spans are missing, confirm that the instrumentation supports the installed library version and that the module was not imported first. When traces are disconnected, inspect propagation at the boundary and ensure asynchronous callbacks preserve context.
When dashboards are expensive or slow, inspect metric cardinality before blaming the backend. Raw URLs, IDs, tenant names, and error text are common causes. Replace them with route templates and controlled categories, then evaluate whether the old time series need an adjusted retention policy.
When spans look successful despite a failing HTTP response, remember that framework instrumentation and domain semantics may differ. Set span status deliberately for domain failures, record exceptions when they occur, and keep response codes. Do not mark every 4xx response as an internal error without deciding what the service considers exceptional.
Frequently asked questions
Must I run an OpenTelemetry Collector?
Not always. An application can export directly to a supported backend, but a collector provides a stable endpoint, batching, filtering, enrichment, retries, and vendor decoupling. It becomes especially valuable when several services need consistent policy.
Should I start with traces, metrics, or logs?
Start with the signal that answers the most urgent operational question. For request-path debugging, traces plus existing structured logs are a practical first step. Add service-level metrics for alerting and capacity, then improve correlation across all three signals.
Why are my Node.js spans missing?
The most common reason is initialization order: the instrumented library loaded before the OpenTelemetry hooks. Other causes include an incorrect OTLP endpoint, disabled instrumentation, unsupported package versions, sampling, or collector export failures.
Is it safe to put user IDs in span attributes?
Only if policy, consent, access control, and retention allow it. Most systems do not need the raw identifier. Prefer a non-sensitive classification or keep the detail in a protected system that can be correlated under controlled access.
Make observability an operated interface
Instrumentation is production code. Give it ownership, reviews, tests, version tracking, cost budgets, and a rollback path. Document the questions each signal answers and remove data that no longer has a purpose.
If your observability product needs a clearer tutorial, integration guide, or troubleshooting system, explore our developer content service. Deep examples work best when readers can reproduce the environment and understand every operational trade-off.