
Developer Tooling
OpenTelemetry redaction: remove span and event attributes

Removing a span attribute with the OpenTelemetry attributes processor does not remove the same key from a span event. The corrected pipeline in this walkthrough uses separate span and resource deletion rules, then a transform statement in the spanevent context. It checks the exported trace to confirm that all targeted values are gone.
The first configuration deliberately misses an event email address. Sending one synthetic trace through Collector Contrib 0.133.0 reproduces the leak; sending it through the corrected configuration verifies the fix. A retained customer.tier attribute helps confirm that useful telemetry survived. You will inspect both exports, identify which processor handles each location, and see what the test still leaves for a broader redaction policy.
The Collector example and test runner are available with the recorded results.
Run the synthetic trace redaction test
Before you start:
- Install Python 3.11 or newer, Git, and Docker. Confirm the Docker engine is running with
docker info. - Run the commands from the repository root after cloning. The examples use pinned container versions and download them on the first run.
- Use a local development machine with room for disposable containers. The harness removes the resources it creates.
The harness starts the Collector with an OTLP/HTTP port bound to loopback, sends the fixture, and reads the file exporter output. It repeats the process with the corrected configuration and removes both containers afterward.
git clone https://github.com/emminextechdocs/developer-examples.git
cd developer-examples
python3 deep-dives/walkthrough.py otel
The output includes otel-export-before.json, otel-export-after.json, and the assertion record otel.json under deep-dives/evidence. Every email address and bearer-like value is synthetic. Do not replace them with real credentials to test whether a pipeline leaks.
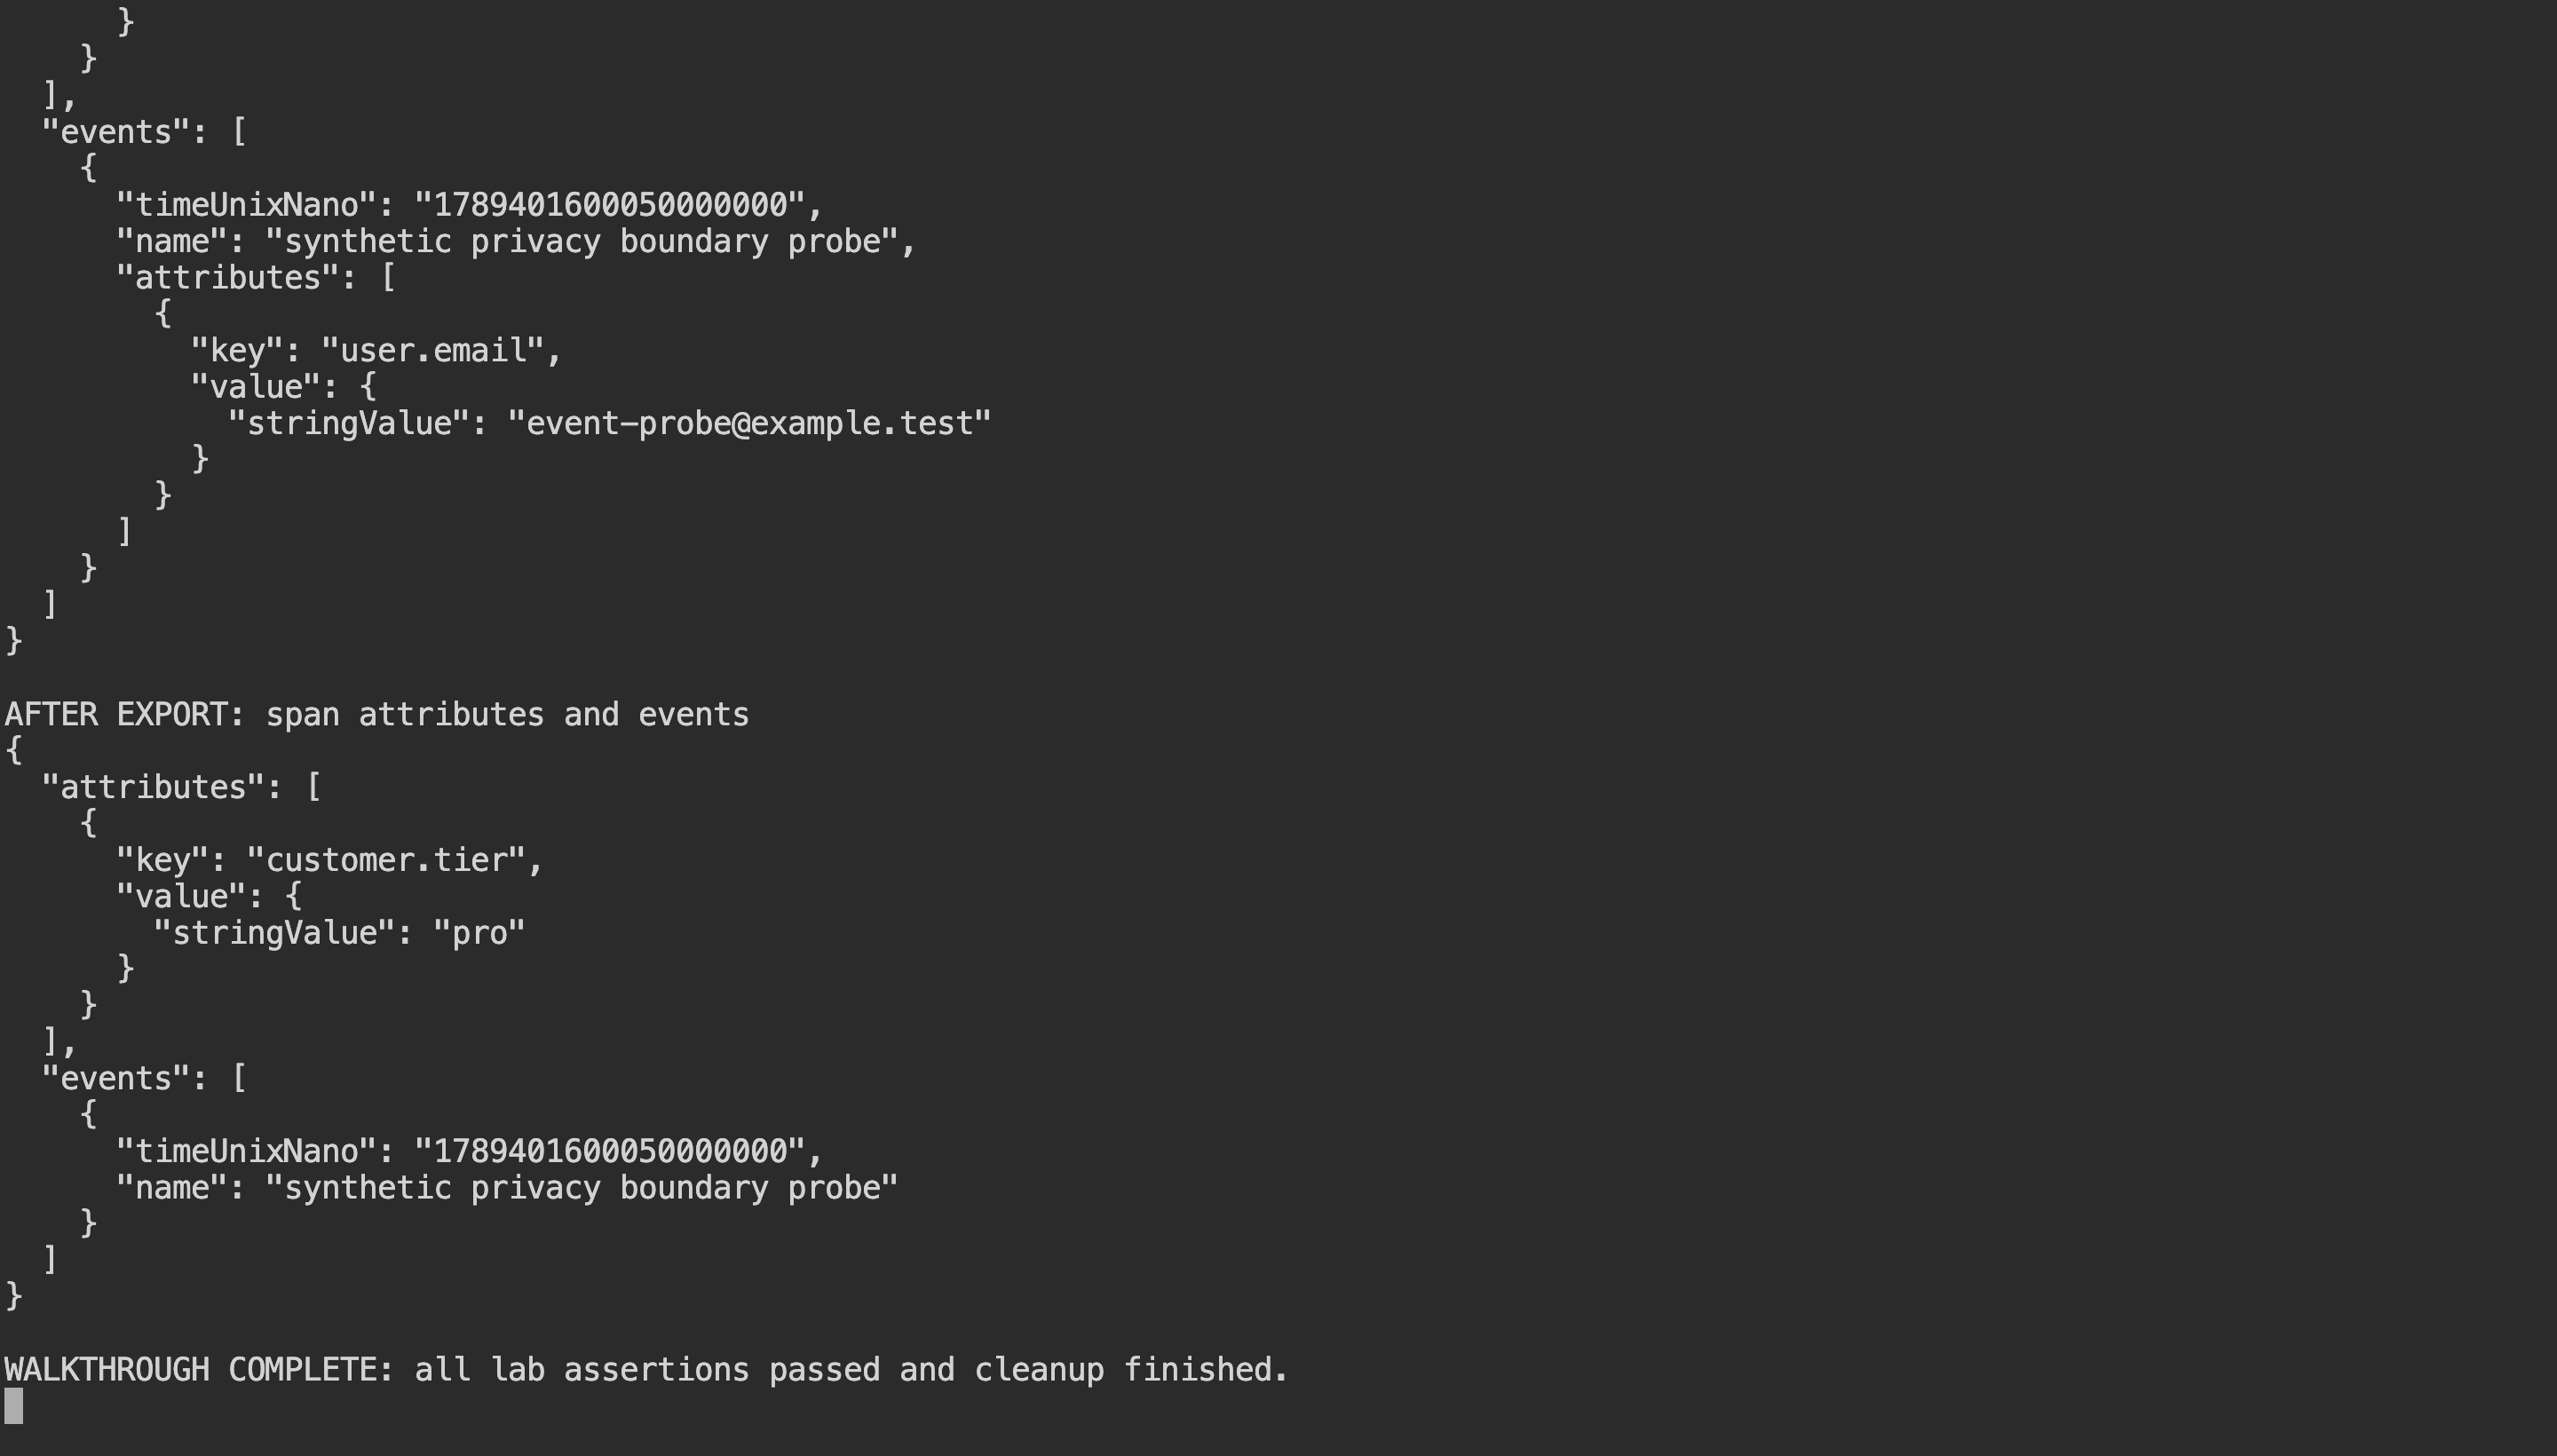
walkthrough.py runs the lab and prints selected commands and their responses alongside the assertions. Open the full-resolution capture.
Inspect the result before changing the example
The runner writes a fresh JSON record and exits after cleanup. To print only its assertions, run:
python3 - <<'PYTHON'
import json
from pathlib import Path
report = json.loads(Path("deep-dives/evidence/otel.json").read_text())
assert report["passed"] is True
for event in report["events"]:
    if "assertion" in event:
        print(event["assertion"], "=>", event["actual"])
PYTHON
This prints each assertion and its observed value from your latest run. If a check fails, fix its setup or implementation and rerun the lab. The following sections explain what the checks establish.
Identify attributes at each telemetry level
A trace payload contains resource information, instrumentation scope information, spans, and span events. Attributes can appear at different levels. Select the processor context for each attribute location.
The trace concepts documentation describes the data model. Our fixture places host.name on the resource, two sensitive-looking fields on the span, and another user.email attribute on a span event. It also includes customer.tier, which should survive the redaction.
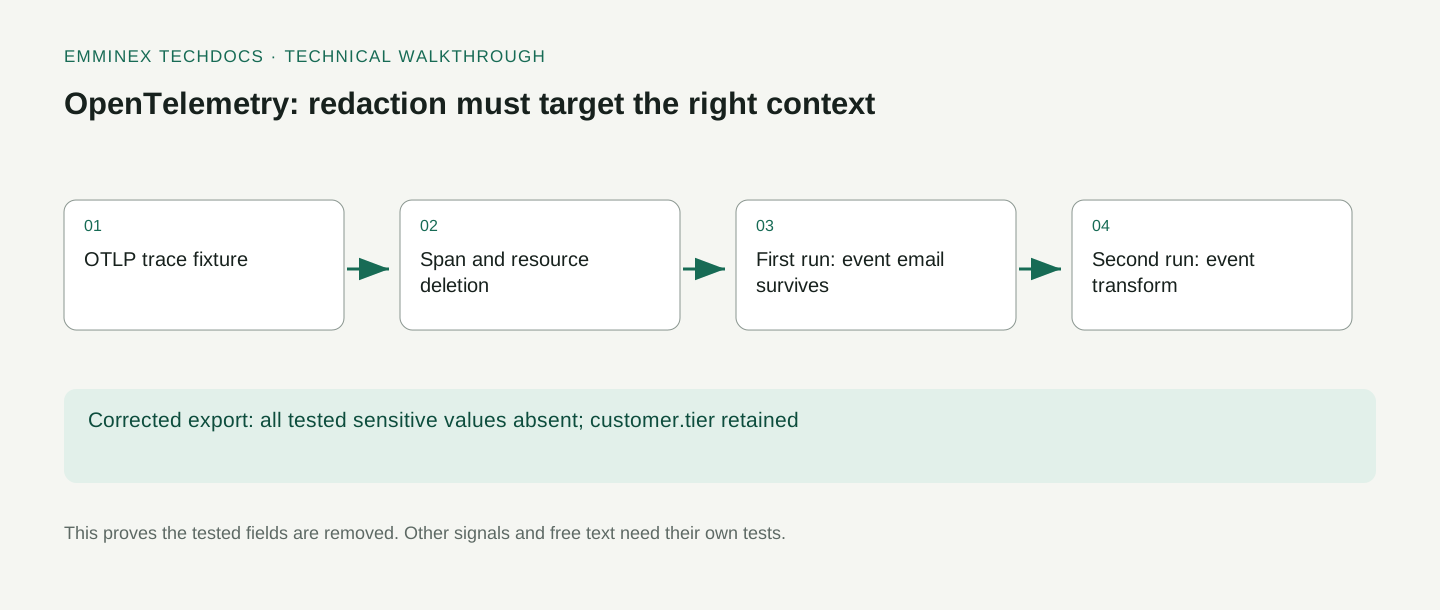
Inventory the fields your application emits, including exception events, URLs, database statements, log bodies, and custom attributes. This sample covers selected locations in one trace.
Inspect the OTLP/HTTP JSON payload
The fixture sends OTLP/HTTP JSON to /v1/traces. Trace and span IDs use hexadecimal strings, and nanosecond timestamps are represented as strings. The payload has a fixed synthetic span so that before-and-after comparisons remain straightforward.
{
  "resourceSpans": [{
    "resource": {"attributes": [
      {"key": "service.name", "value": {"stringValue": "checkout-lab"}},
      {"key": "host.name", "value": {"stringValue": "synthetic-host"}}
    ]},
    "scopeSpans": [{
      "scope": {"name": "emminex-redaction-lab"},
      "spans": [{
        "traceId": "11111111111111111111111111111111",
        "spanId": "2222222222222222",
        "name": "POST /orders",
        "kind": 2,
        "startTimeUnixNano": "1789401600000000000",
        "endTimeUnixNano": "1789401600100000000",
        "attributes": [
          {"key": "user.email", "value": {"stringValue": "synthetic-person@example.test"}},
          {"key": "http.request.header.authorization", "value": {"stringValue": "Bearer synthetic-test-value"}},
          {"key": "customer.tier", "value": {"stringValue": "pro"}}
        ],
        "events": [{
          "name": "synthetic privacy boundary probe",
          "timeUnixNano": "1789401600050000000",
          "attributes": [{"key": "user.email", "value": {"stringValue": "event-probe@example.test"}}]
        }]
      }]
    }]
  }]
}
The OTLP specification defines the transport and JSON encoding rules. Use that specification when constructing test payloads instead of assuming an arbitrary JSON representation of a span will be accepted.
These fixed timestamps are fixtures, not measurements of the current request. The test is about transformation and export, not latency calculation. If you adapt it for timing analysis, generate appropriate timestamps and validate the resulting duration separately rather than reusing the redaction sample as benchmark data.
Configure span and resource attribute deletion
The first configuration uses an attributes processor to remove two span keys and a resource processor to remove host.name. It then batches traces and writes them through the file exporter. The service pipeline lists the processors in the intended order.
receivers:
  otlp:
    protocols:
      http:
        endpoint: 0.0.0.0:4318
processors:
  attributes/redact:
    actions:
      - key: user.email
        action: delete
      - key: http.request.header.authorization
        action: delete
  resource/redact:
    attributes:
      - key: host.name
        action: delete
  batch:
    timeout: 1s
exporters:
  file:
    path: /evidence/traces.json
service:
  pipelines:
    traces:
      receivers: [otlp]
      processors: [attributes/redact, resource/redact, batch]
      exporters: [file]
The Collector configuration guide explains how receivers, processors, exporters, and service pipelines are connected. Defining a processor is not enough; it must appear in the relevant pipeline. An unused processor does not affect that pipeline’s output.
The example uses Collector Contrib because the selected components are present in that distribution. Do not assume every Collector distribution contains the same processors and exporters. Preserve the tested distribution and version when reproducing the fixture, then validate component availability when changing your deployment image.
Check the first exported trace
The harness parses the exported trace rather than searching only the incoming request or startup log. It verifies that the configured span keys are absent, host.name is absent from resource attributes, and customer.tier remains.
The assertions check removed fields and retained data together. A pipeline that drops all telemetry would also make a sensitive string disappear, but it would not satisfy the intended behavior. Keeping a non-sensitive control attribute makes that false success harder to miss.
The version-specific attributes processor documentation and resource processor documentation describe the actions used. Review the component implementation’s version rather than relying solely on current examples when maintaining an older pinned Collector.
Verify that the span-event email survives
The first pipeline is expected to leave event-probe@example.test in the span event. The test requires that value to be present. The test fails if this expected first-run result changes, prompting a review of the processor behavior.
The surviving event value exposes the first configuration’s incomplete coverage. It demonstrates the processor’s scope. A reader can inspect the exported event and see precisely which assumption failed.
Store the leak-test payload beside the Collector configuration. Add the same synthetic value to every location that your instrumentation can produce, including nested or free-text locations where relevant. Then inspect the final exported structure. A list of deletion rules is not proof that those rules cover the places data actually appears.
Delete the event attribute with a transform
The corrected configuration adds a transform processor with a spanevent context and deletes user.email from that context’s attributes. It retains the original span and resource rules, because removing the event field does not make those other locations disappear automatically.
receivers:
  otlp:
    protocols:
      http:
        endpoint: 0.0.0.0:4318
processors:
  attributes/redact:
    actions:
      - key: user.email
        action: delete
      - key: http.request.header.authorization
        action: delete
  resource/redact:
    attributes:
      - key: host.name
        action: delete
  transform/events:
    error_mode: propagate
    trace_statements:
      - context: spanevent
        statements:
          - delete_key(attributes, "user.email")
  batch:
    timeout: 1s
exporters:
  file:
    path: /evidence/traces.json
service:
  pipelines:
    traces:
      receivers: [otlp]
      processors: [attributes/redact, resource/redact, transform/events, batch]
      exporters: [file]
Read the configuration as a scoped operation: context: spanevent selects event attributes, delete_key removes the named key, and the pipeline’s processor list determines whether this transform runs. Deleting a similarly named span attribute earlier does not substitute for this event transform.
The pinned transform processor documentation defines the context and statement format. The context tells reviewers that this deletion applies to events rather than span attributes.
The processor uses error_mode: propagate for this fixture. In the pinned processor, a statement error is returned up the pipeline and causes the affected payload to be dropped. Before adopting it, test processor errors, malformed input, and unexpected data shapes. Inspect both the pipeline output and the response returned to the sending client when choosing how your deployment handles transformation failures.
Check the corrected exported payload
Read both files produced by your run:
python3 - <<'PYTHON'
import json
from pathlib import Path
for stage in ("before", "after"):
    path = Path(f"deep-dives/evidence/otel-export-{stage}.json")
    data = json.loads(path.read_text())
    span = data["resourceSpans"][0]["scopeSpans"][0]["spans"][0]
    attributes = {item["key"] for item in span["attributes"]}
    event_keys = {item["key"] for event in span["events"]
                  for item in event.get("attributes", [])}
    print(stage, "span:", sorted(attributes), "events:", sorted(event_keys))
PYTHON
This reads the serialized export rather than assuming configuration implies success. Compare the key sets:
- Before the transform,
customer.tierremains on the span anduser.emailremains on its event. - After the transform,
customer.tierstill remains, butuser.emailis absent from the event. - The assertions separately check the span and resource deletions. This small printout focuses on the event-level leak.
An unchanged event key set is a failed redaction check. Verify that the transform is attached to the traces pipeline and uses the spanevent context before changing the test payload.
The second run requires all three synthetic sensitive values to be absent from the exported trace. It also requires customer.tier to remain. The comparison therefore checks the specific leak, the original removals, and preservation of useful telemetry.
An HTTP success response alone does not show which fields reached the exporter. The test waits for the output file and inspects the exported trace, including its resource, span, and event attributes.
The file exporter documentation describes the output mechanism used for inspection. This fixture’s local file is a test sink. It is not a recommendation to retain production telemetry with sensitive fields on an unrestricted filesystem.
Apply redaction to every export path
A pipeline can export through more than one path. If one path applies redaction and another sends the original data elsewhere, checking only the protected exporter leaves the broader flow unverified. Inventory every receiver, pipeline, connector, and exporter that can carry the relevant signal.
The telemetry transformation guide provides the broader processing context. For a deployment review, trace the synthetic probe through the same routes used by production data. Record where it is accepted, transformed, sampled, and exported.
This is especially important when adding a debug exporter during incident response. Debug output can become another place where incoming telemetry is retained. Test and document that path with the same care as the primary backend instead of treating logs as outside the data-handling policy.
Minimize sensitive data in instrumentation
Collector-side redaction is one control, not a reason to instrument every available value. Avoid collecting credentials and unnecessary personal fields at the source when the application can omit them. That reduces the number of buffers, processes, and transport boundaries through which those values pass.
OpenTelemetry’s sensitive-data guidance discusses the risks and available approaches. The fixture deliberately includes synthetic values to test a policy; production instrumentation should begin with a narrower collection decision.
Prefer route templates over raw URLs when raw paths contain identifiers, and review exception messages and custom events. These are examples of locations to investigate, not a claim that one naming convention guarantees privacy. The actual instrumentation and application data determine what can be exposed.
Test alternate keys and free-text values
Deleting user.email does not remove an email address embedded in an event name, exception message, URL, or another key. The corrected fixture proves removal of the values it places in specific locations. It does not claim to recognize every possible representation of sensitive data.
Expand the test corpus using realistic synthetic shapes. Include unexpected casing, alternate attribute names, arrays, nested values where supported, and free-text fields your application emits. Decide whether the policy should remove a field, replace it, or prevent its collection entirely.
Avoid describing a few passing string checks as a compliance certification. The evidence records these configurations and their exported results on Collector Contrib 0.133.0. Keep the source, payloads, assertions, and version together so that claim remains reproducible.
Retest redaction during pipeline failures
Redaction happens inside a running telemetry system with queues, memory limits, retries, and shutdown behavior. This small fixture does not test sustained overload, backend outages, or delivery guarantees. Add those experiments when the pipeline’s operational requirements demand them.
Preserve the privacy assertions during those failure tests. A fallback path, retry exporter, or emergency debug configuration should not silently bypass the transformation policy. Test what leaves the process under failure, not only what leaves it during the normal run.
Our Node.js OpenTelemetry walkthrough explains application instrumentation, while the developer portal checklist helps make operational guidance discoverable. Document the tested pipeline boundaries next to the configuration owners and incident runbooks.
Record what the redaction policy covers
The corrected configuration removes the demonstrated span-event attribute. It does not remove the event itself, rewrite its name, or inspect every string in the trace. Keep those exclusions in the review record so that a successful fix does not gradually become an unsupported claim of complete sanitization.
The two exports show the scope of each rule:
| Location and attribute | Processor | First export | Corrected export |
|---|---|---|---|
Resource: host.name |
resource/redact |
Removed | Removed |
Span: user.email |
attributes/redact |
Removed | Removed |
Span: http.request.header.authorization |
attributes/redact |
Removed | Removed |
Event: user.email |
transform/events, added in the corrected pipeline |
Retained | Removed |
Span: customer.tier |
No deletion rule | Retained | Retained |
Extend this inventory when instrumentation changes. Record the location, synthetic value, chosen treatment, and exported result for each new field. A familiar attribute name does not mean the existing rule reaches its location.
Test preservation alongside removal at every new location. If a rule drops an entire event, confirm that this loss of diagnostic context is intentional. If a rule replaces a value, verify the replacement rather than merely checking that the original is absent. If malformed input causes the pipeline to reject data, record that outcome separately from successful redaction.
Also review who can change the configuration. A correctly tested pipeline can lose its properties if an emergency override bypasses processors or changes exporter routing. Run the probe during deployment checks. Store the configuration hash, input payload, and exported result together so reviewers can reproduce the test and identify fields it does not cover.
Frequently asked questions
Does the attributes processor delete span-event attributes?
The tested Collector Contrib 0.133.0 pipeline removes its configured span attributes but leaves the event’s user.email. The corrected configuration uses a transform processor with an explicit spanevent context to delete that event attribute. Inspect the final exported payload when verifying the result; an accepted OTLP request does not establish that every targeted location was redacted.
How do you test an OpenTelemetry redaction rule safely?
Send synthetic sentinel values in the telemetry locations you intend to protect, then inspect what reaches the exporter. Assert that the targeted values are absent and that selected harmless data remains. This example retains customer.tier as a control, so dropping the whole trace cannot be mistaken for a successful, useful transformation.
Does this configuration redact logs and metrics?
No. It defines a traces pipeline and tests one trace payload. Logs and metrics have their own structures and need appropriate pipelines, processors, and assertions. Even within traces, an email in a free-text event name or a different attribute key is outside this fixture’s demonstrated deletion rules. Add a test for each required location.
Does error_mode: propagate guarantee that sensitive data never leaves?
No such broad guarantee follows from the setting. It selects the transform processor’s error-handling behavior; the example verifies only the supplied valid payload. Review every exporter path and test malformed input, processor errors, and operational overrides separately. Continue to minimize sensitive data at collection so fewer components receive it in the first place.